This page shows how to reproduce tension-pCa curves with and without an SRX stabilizing effect of the myosin-binding protein-C (MyBP-C). These simulations data were posted as a pre-print on bioRxiv, and they were run using FiberSim version 1.1.2 (you can download it here).
Open an Anaconda Prompt
conda activate fibersim
<FiberSim_dir>/code/FiberPy/FiberPy, where <FiberSim_dir> is the directory where you installed FiberSim.python FiberPy.py run_batch "../../../manuscripts/2021a/batch_pCa_curves.json"
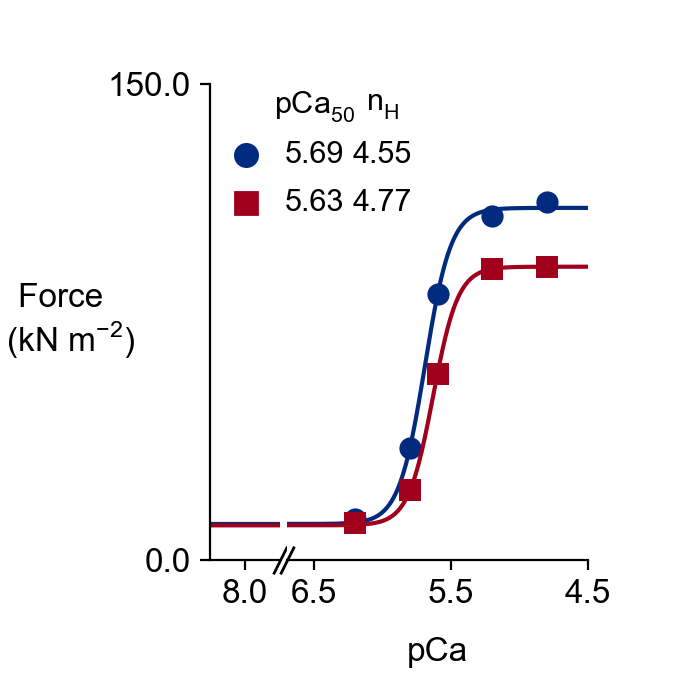
The tension-pCa curves for the control (blue) and the MyBP-C stabilized SRX (red) cases are saved in <FiberSim_dir>/manuscripts/2021a/sim_output/force_pCa_curves.png.
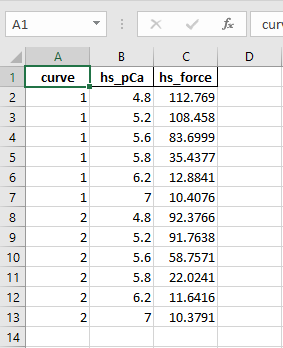
The underlying data are stored in <FiberSim_dir>/manuscripts/2021a/sim_output/analysis.xlsx.
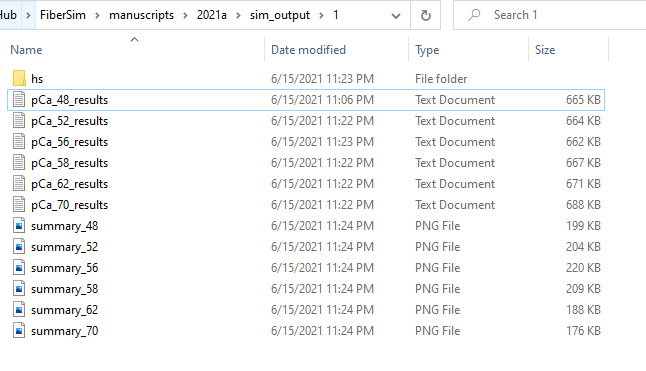
The subfolders <FiberSim_dir>/manuscripts/2021a/sim_output/1 and <FiberSim_dir>/manuscripts/2021a/sim_output/2 contain the simulations results for each pCa value in each case (base and MyBP-C stabilized SRX).
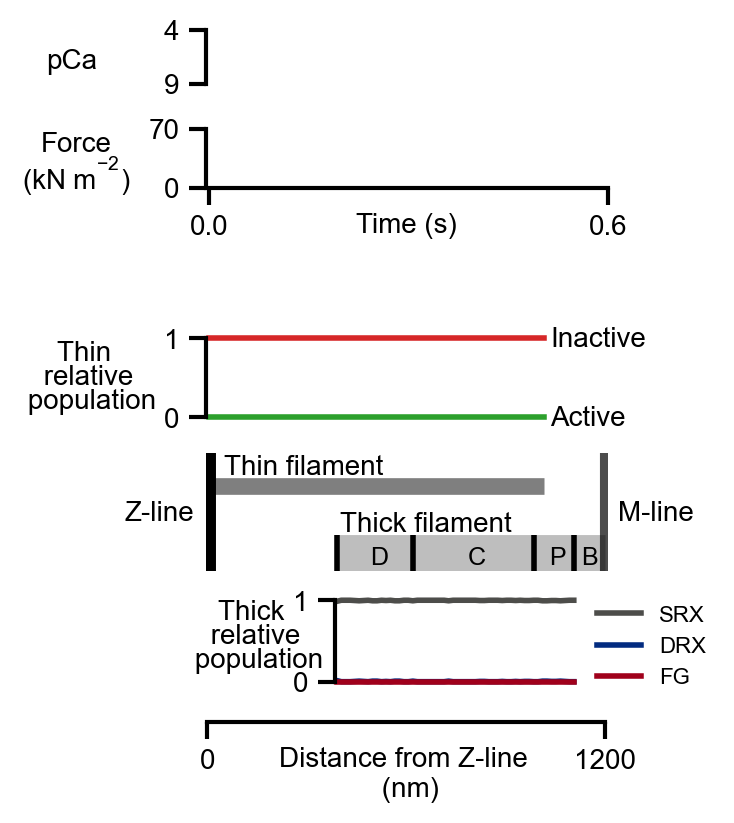
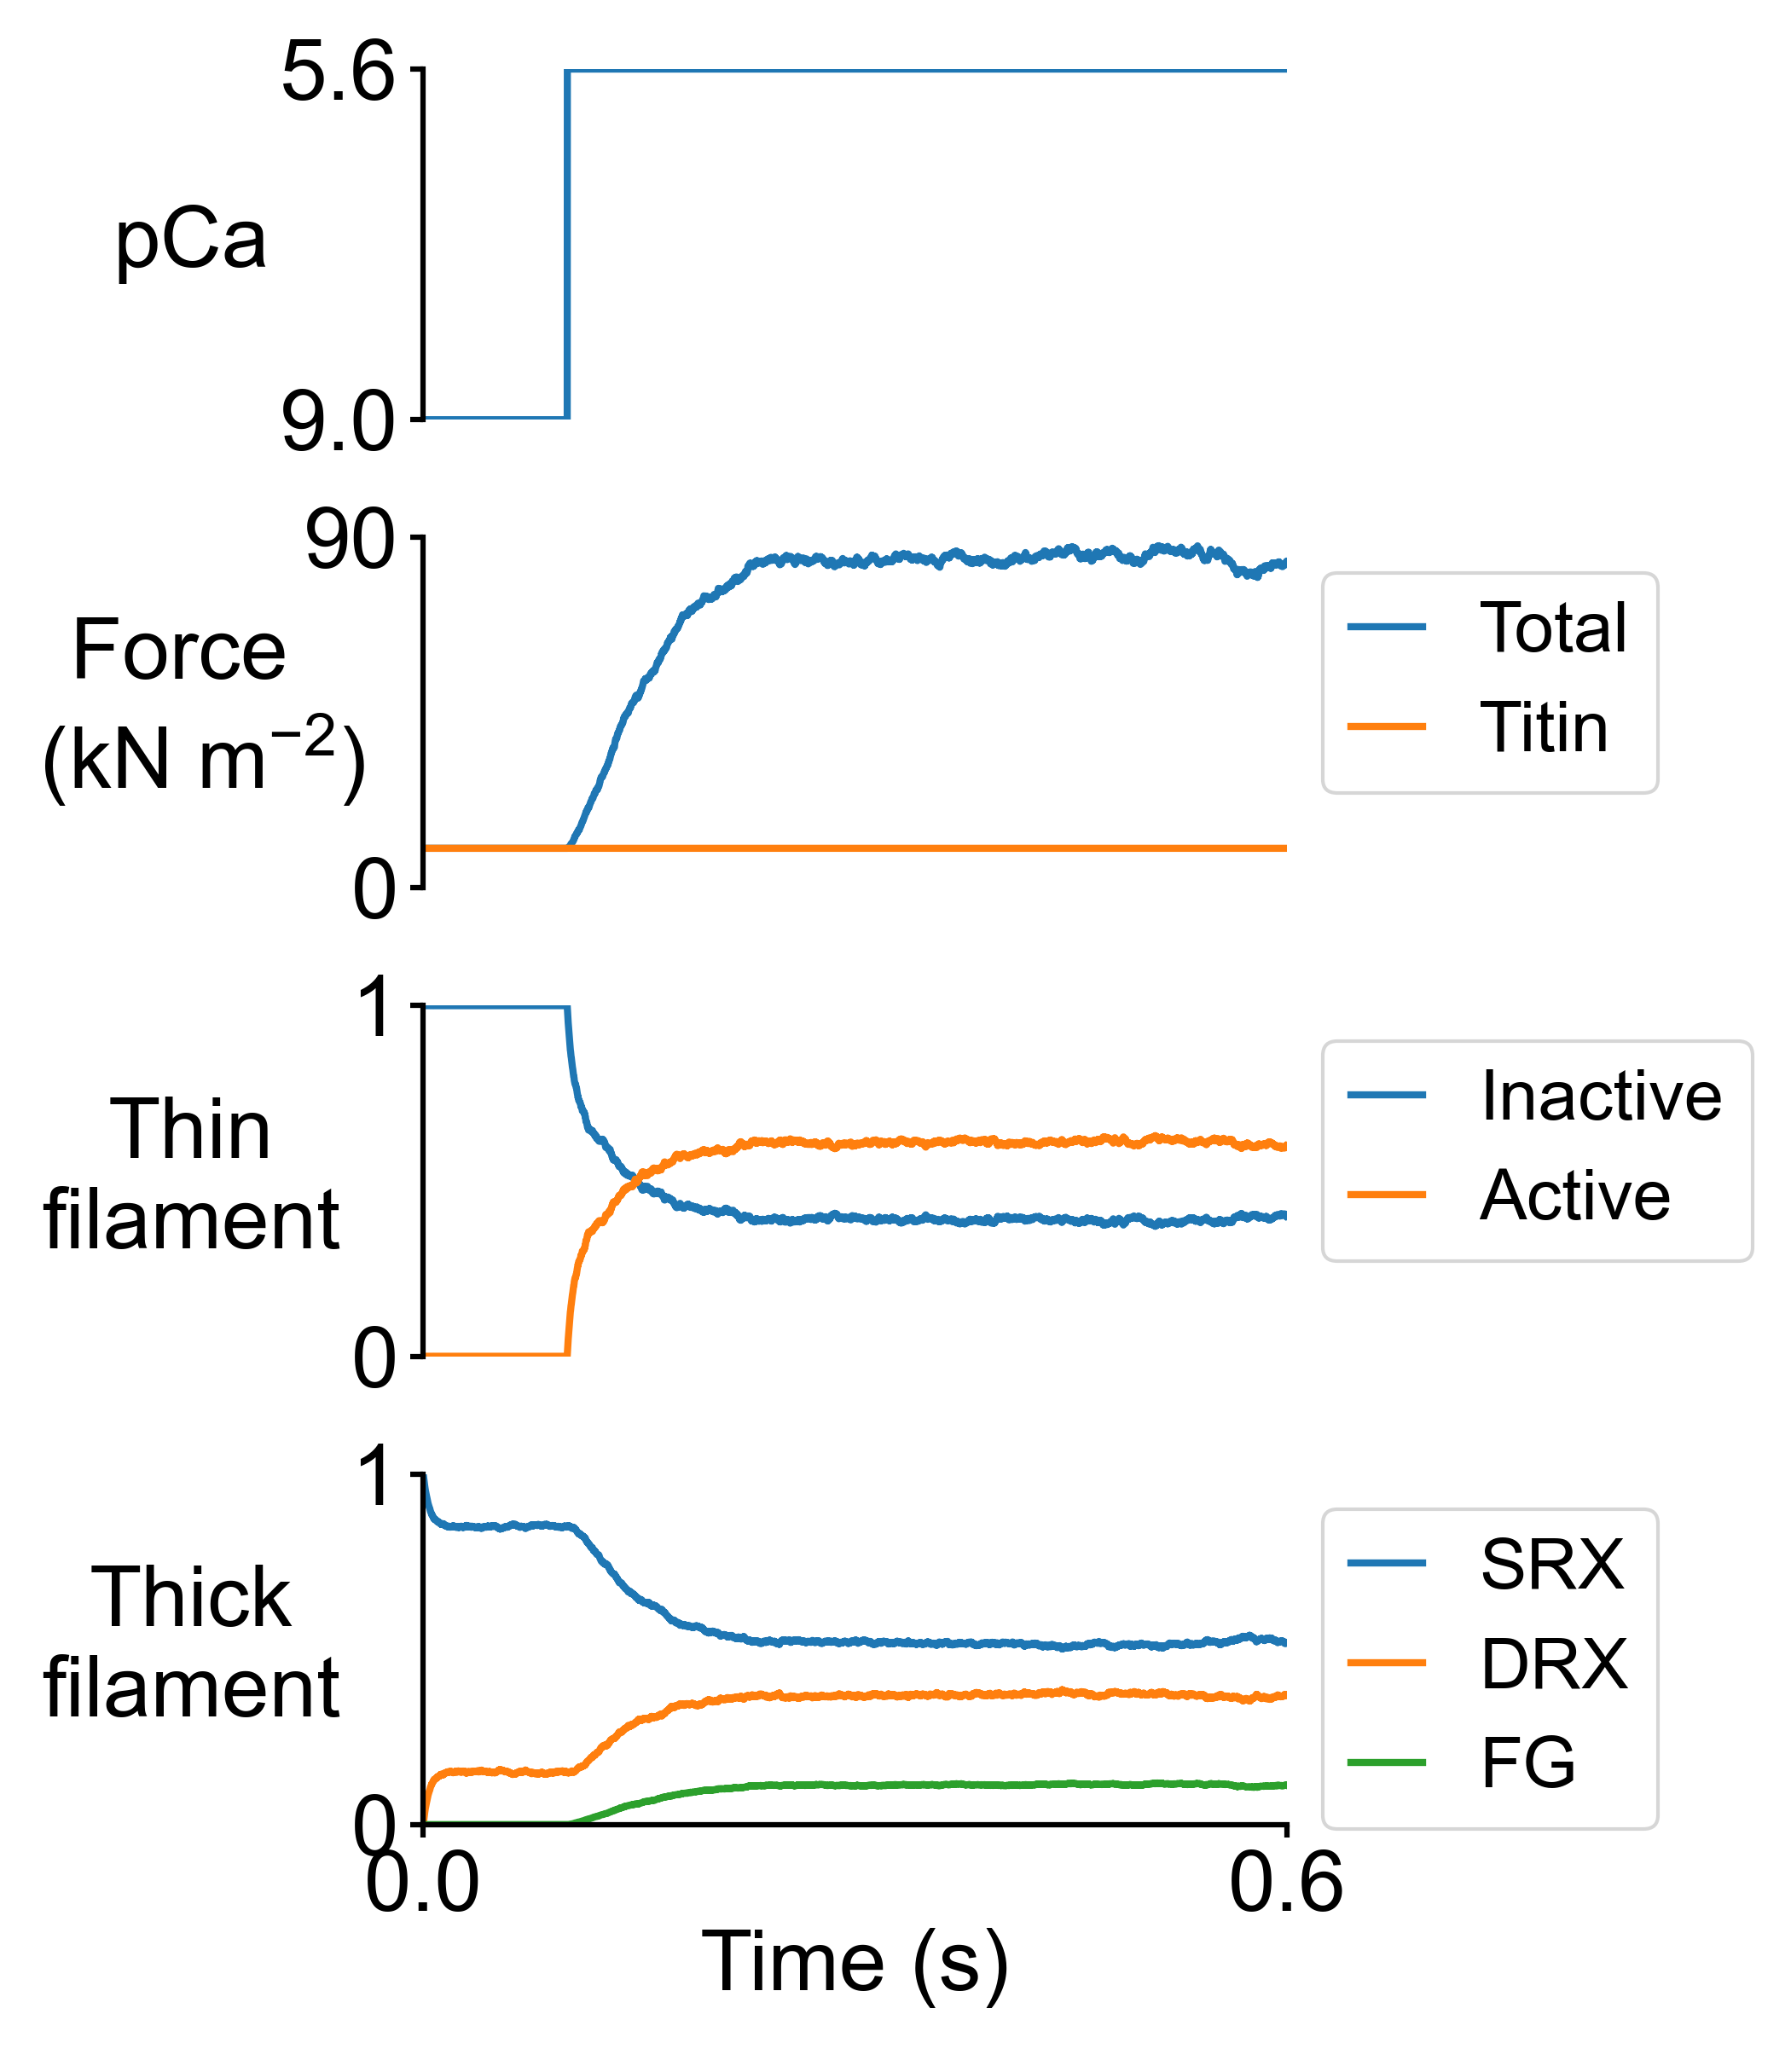
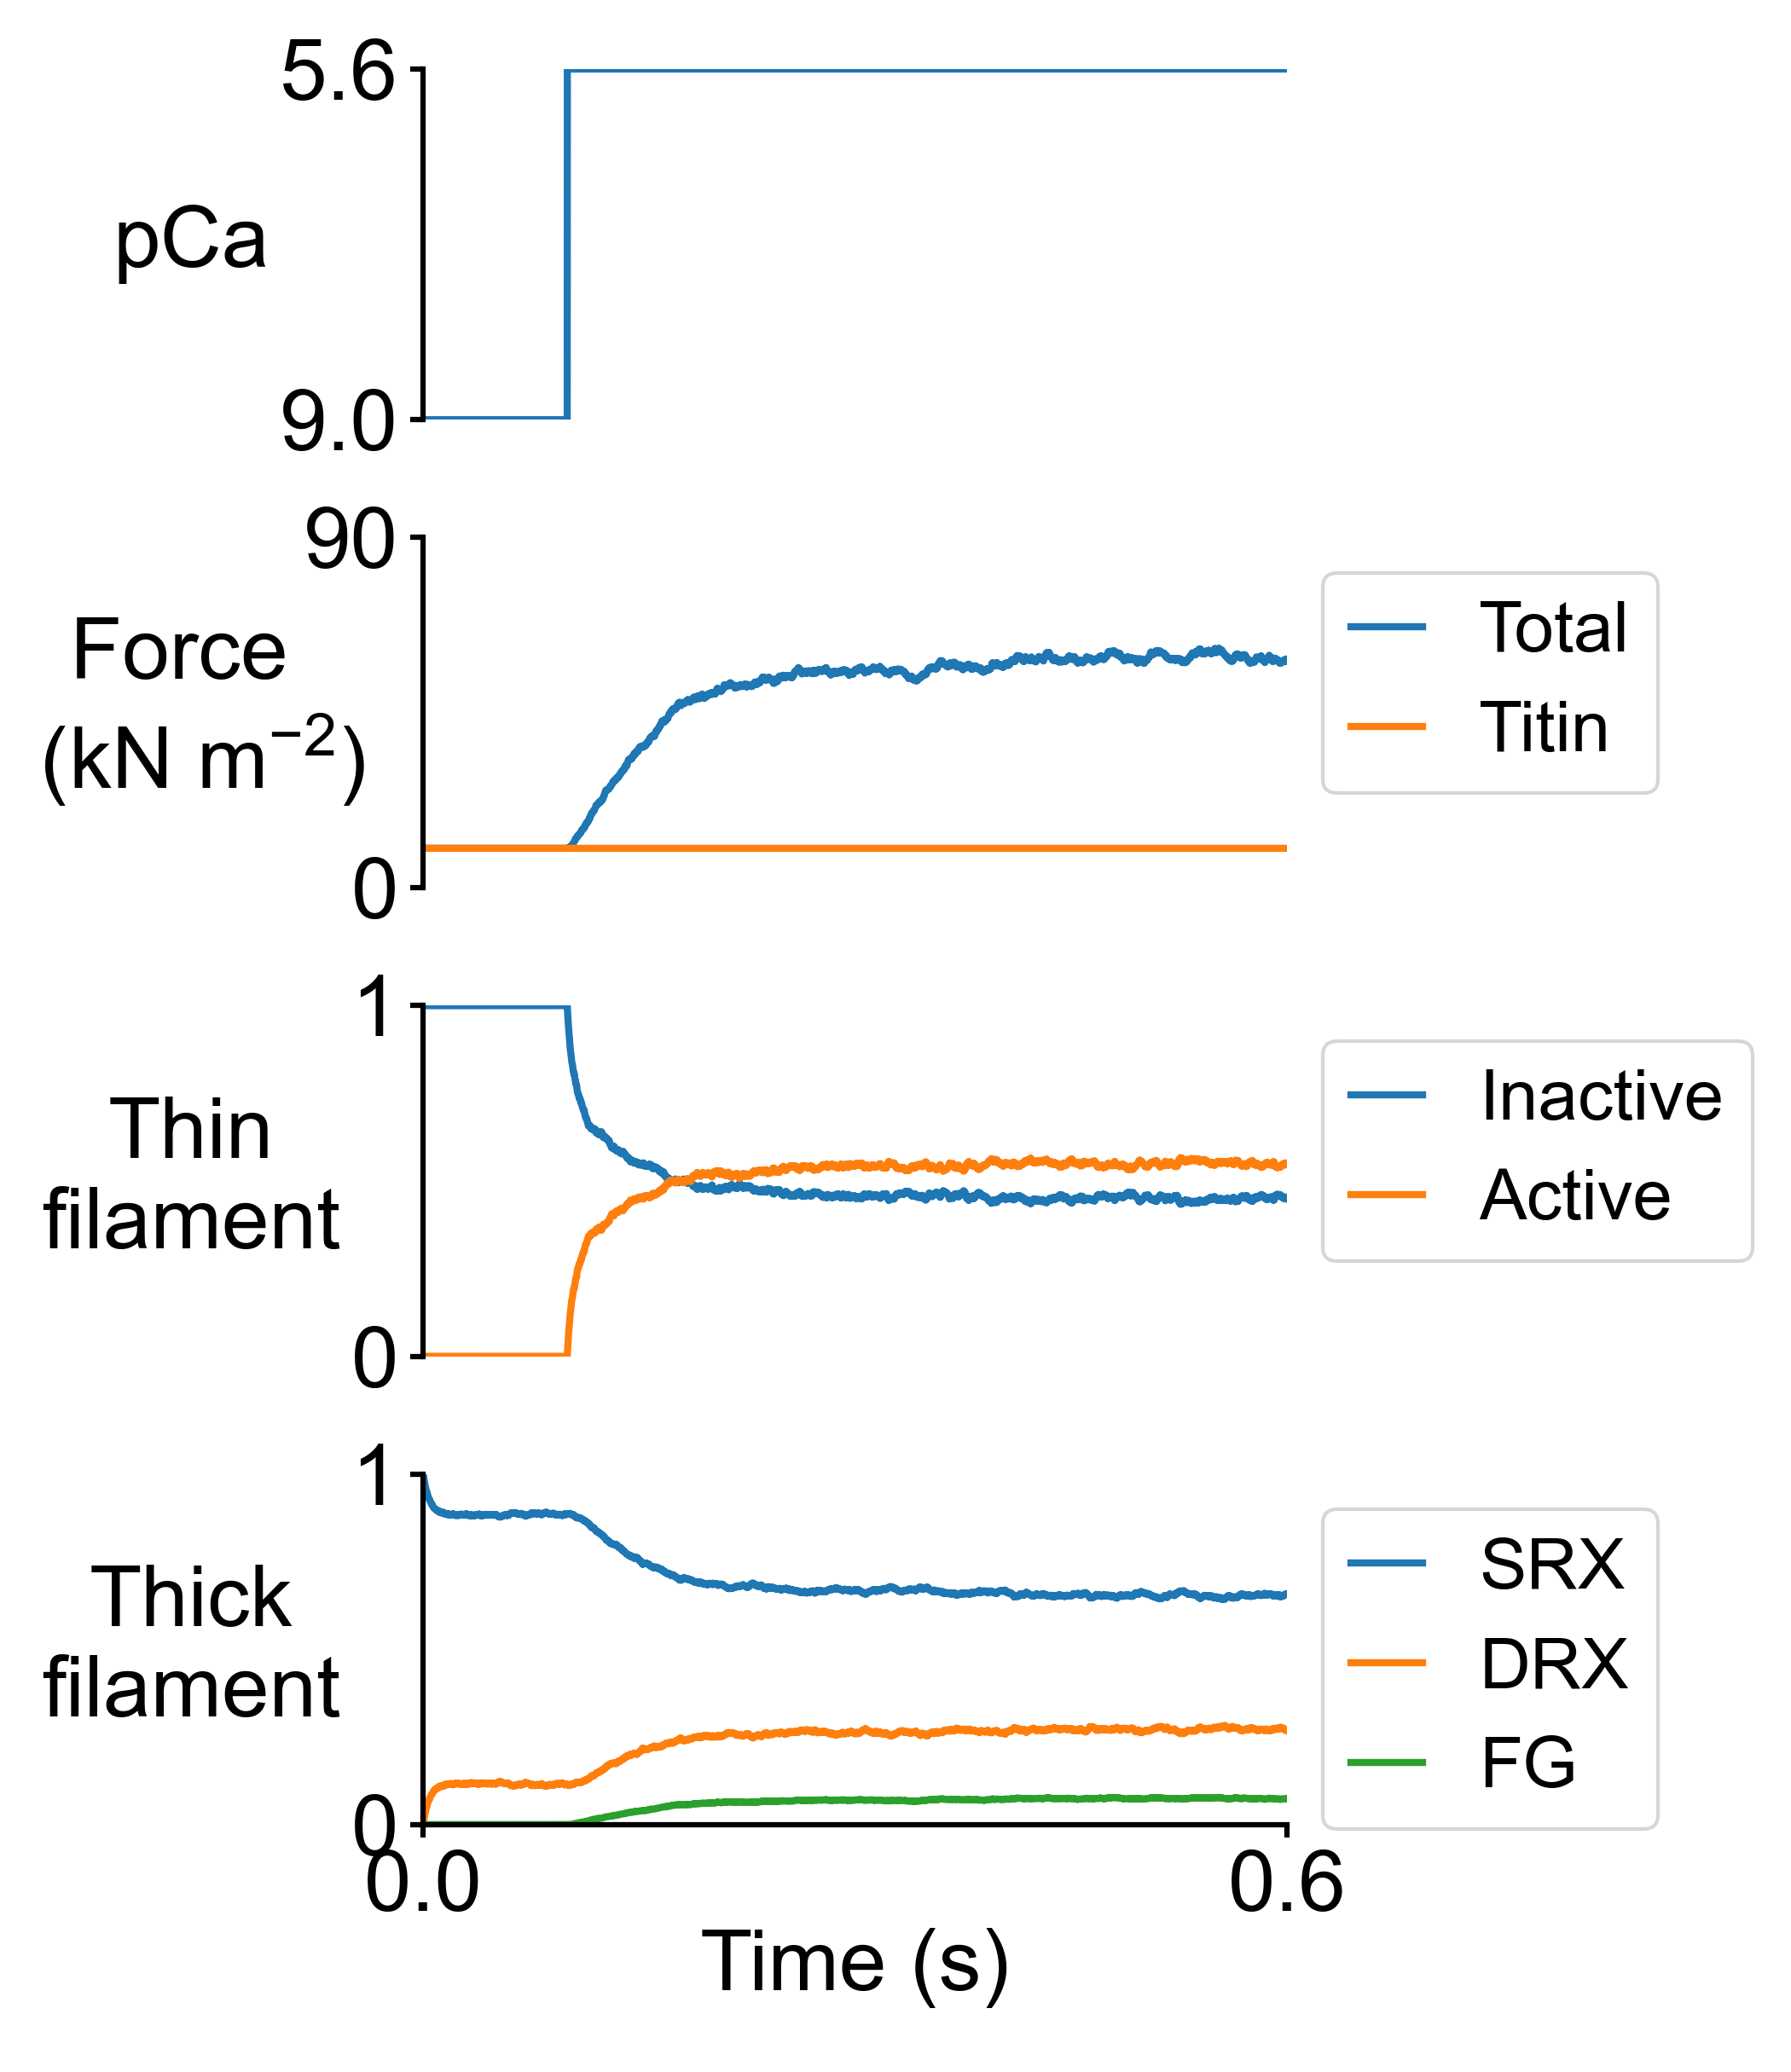
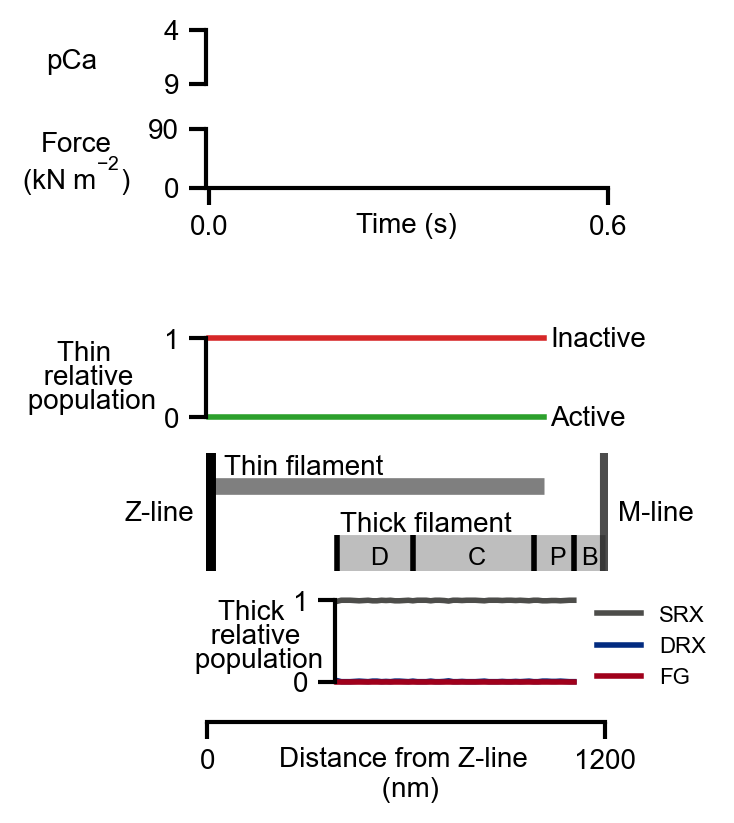
Here are the summary figures for pCa = 5.6 in the base (left) and MyBP-C stabilized SRX case (right).
It is possible to generate snapshots showing the spatial distributions of the actin and myosin populations. Two movies can be generated from the snapshots (one .mp4 movie for the control case, and another one for the MyBP-C stabilized SRX case).
To generate the control movie:
python Fiberpy.py spatial_visualization "../../../manuscripts/2021a/sim_output/1/hs" "../../../manuscripts/2021a/sim_output/1/movie"
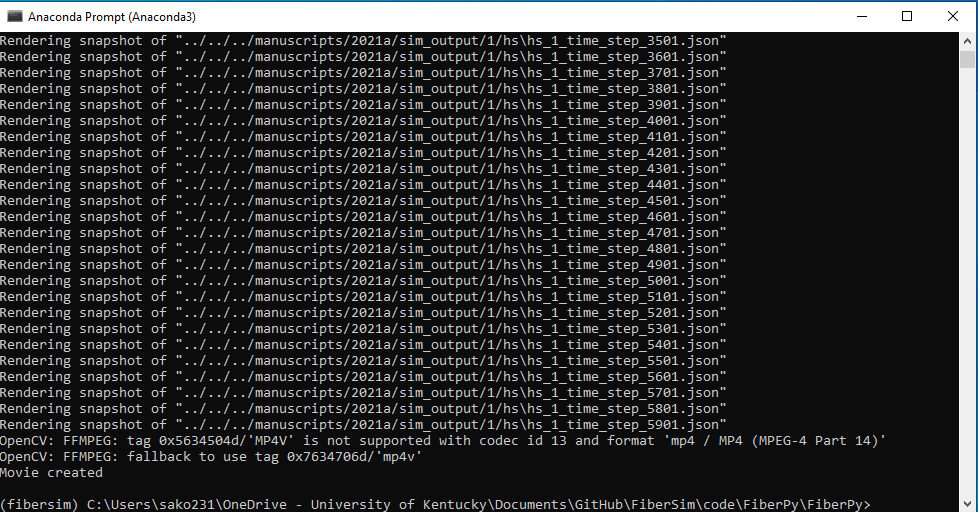
When it finishes (this may take ~2 min), you should a new folder created in <repo>/manuscripts/2021a/sim_output/1 called “movie”.
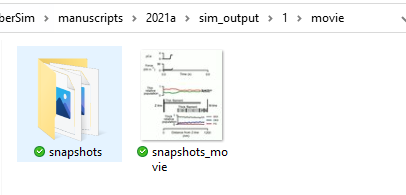
This folder contains the following animated movie:
To generate the MyBP-C stabilized SRX movie:
python Fiberpy.py spatial_visualization "../../../manuscripts/2021a/sim_output/2/hs" "../../../manuscripts/2021a/sim_output/2/movie"
<repo>/manuscripts/2021a/sim_output/2 called “movie”, and containing the snapshots and the .mp4 movie.