This page shows how to reproduce 4 tension-pCa curves corresponding to 4 conditions:
Open an Anaconda Prompt
conda activate fibersim
<FiberSim_dir>/code/FiberPy/FiberPy, where <FiberSim_dir> is the directory where you installed FiberSim.python FiberPy.py run_batch "../../../manuscripts/2021b/MyBPC/batch_pCa_curves.json"
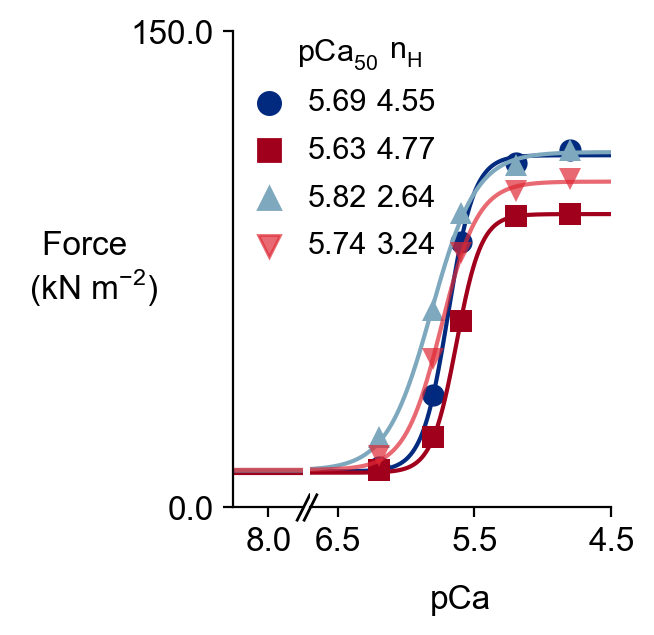
The tension-pCa curves for the four cases are saved in <FiberSim_dir>/manuscripts/2021b/MyBPC/sim_output/force_pCa_curves.png.
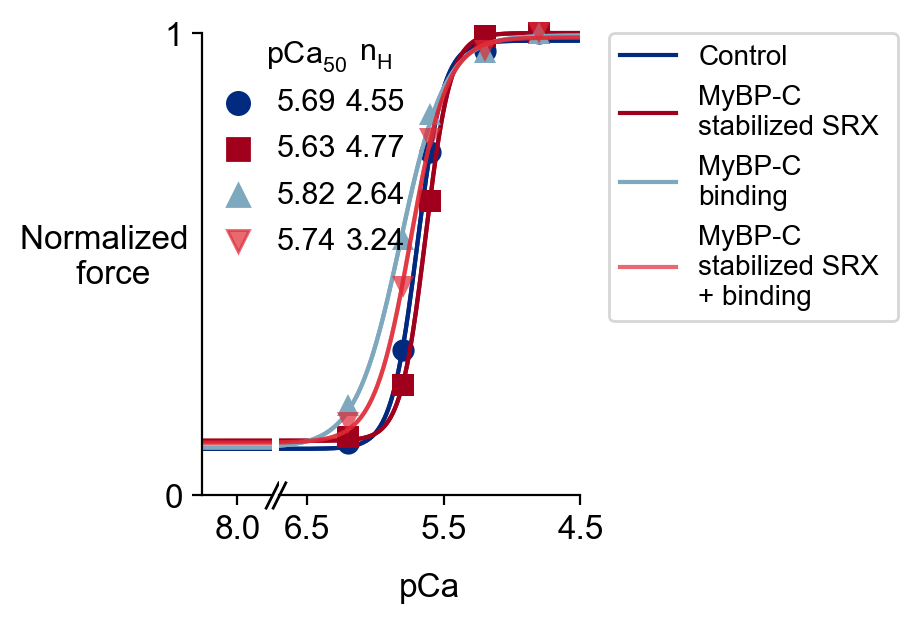
The normalized tension-pCa curves are saved in <FiberSim_dir>/manuscripts/2021b/MyBPC/sim_output/force_pCa_curves_normalized.png.
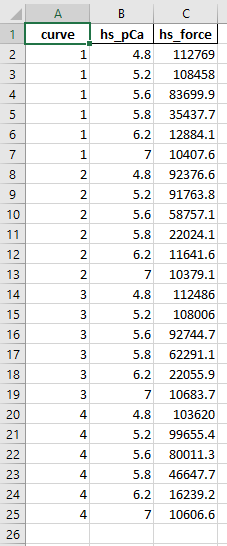
The underlying data are stored in <FiberSim_dir>/manuscripts/2021b/MyBPC/sim_output/analysis.xlsx.
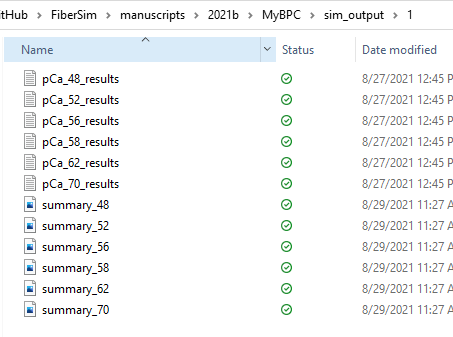
The 4 subfolders from <FiberSim_dir>/manuscripts/2021b/MyBPC/sim_output contain the simulations results and summary figures for each pCa value in each case (base, MyBPC stabilized SRX, MyBPC actin binding, and MyBPC stabilized SRX + MyBPC actin binding).