Two-way nanostring
This example builds on two_way_lmm but loops through an array of variable names running a test on each set of values.
Requirements
Uses:
Code
function figure_two_way_nanostring
% Code runs two-way linear mixed model with grouping
% Variables
data_file_string = 'data/merged_data.xlsx';
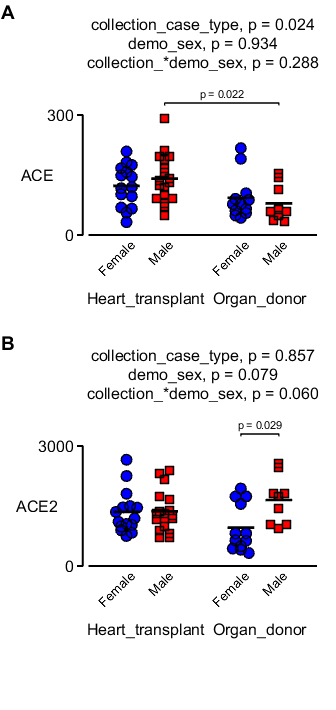
gene_names = {'ACE', 'ACE2'};
% Code
% Make a figure with two panels
sp = initialise_publication_quality_figure( ...
'no_of_panels_wide', 1, ...
'no_of_panels_high', 2, ...
'x_to_y_axes_ratio', 2, ...
'axes_padding_left', 0.8, ...
'axes_padding_right', 0.2, ...
'right_margin', 4.5, ...
'axes_padding_top', 1.2, ...
'axes_padding_bottom', 1);
% Read data
d = readtable(data_file_string);
% Loop through the gene-names making a two-way graph in each panel
for i = 1:2
two_way_jitter( ...
'data_table', d, ...
'test_variable', gene_names{i}, ...
'factor_1', 'collection_case_type', ...
'factor_1_strings', {'Heart_transplant','Organ_donor'}, ...
'factor_2', 'demo_sex', ...
'grouping', 'hashcode', ...
'calling_path_string', cd, ...
'axis_handle', sp(i), ...
'title_y_offset', 1.6, ...
'y_label_offset', -0.2, ...
'y_main_label_offset',0.45);
end
How this works
- Set variables at top
- Make a figure with two panels
- Loop through the panels
- Using two_way_jitter.m to plot data and add results from a two-way linear-mixed-model with grouping for each genename
Output