Sampling of 1 variable
This dataset consists of n=100 isometric twitches simulated with 1 ms resolution.
Simulations were run with values of the following variables selected based on a Latin hypercube design.
| Variable | Description | Min value (multiple of base) | Max value (multiple of base) | Base value |
|---|---|---|---|---|
| m_1_2_2_1 | A myosin rate constant | 10-0.5 | 100.5 | 200 |
In this example, m_1_2_2_1 ranged between 10-0.5 * 200 = 63 and 100.5 * 200 = 632.
How to generate these data
- Follow the instructions for the FiberSim demo but …
- … run the command
python FiberPy.py sample "<path_to_this_repo>/simulations/n_vars_1/base/setup.json
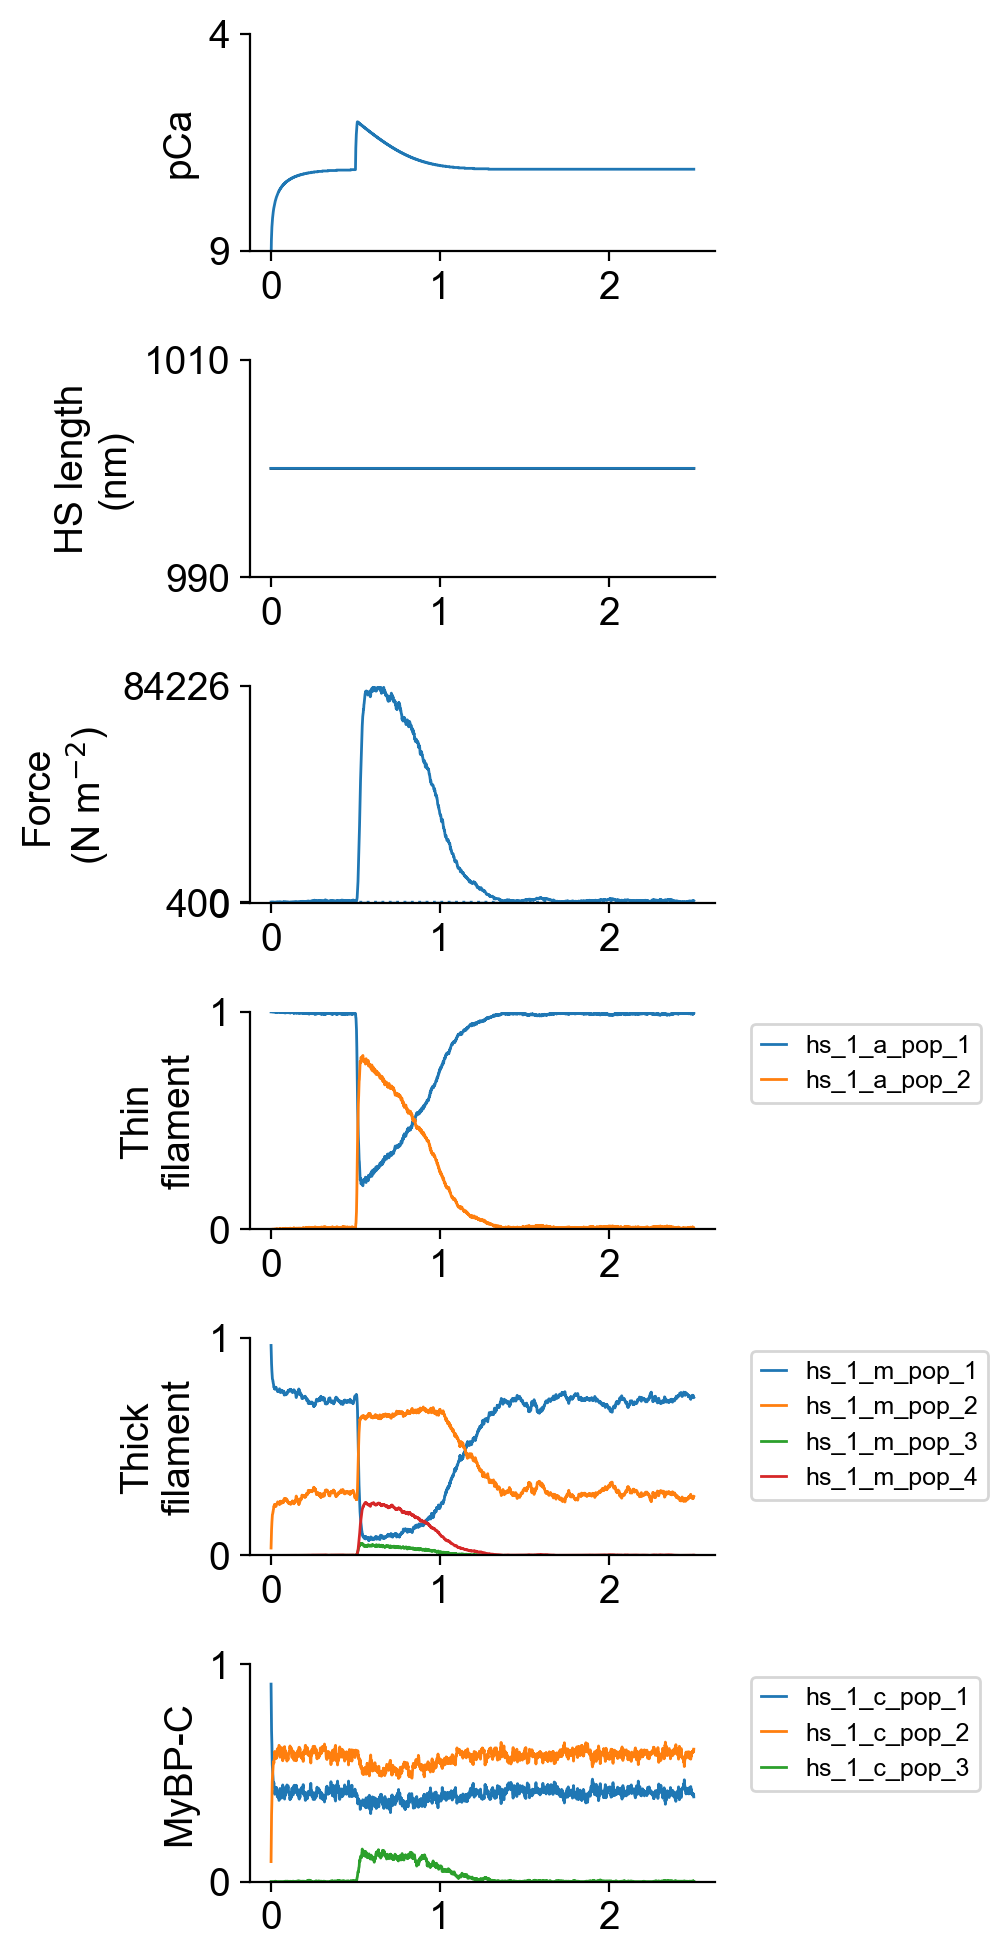
Example of a single trial
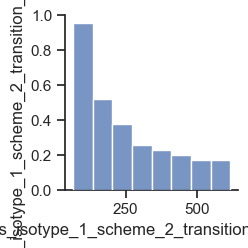
Pair-plot
This figure shows the distribution of the parameter values. The histogram has a concave profile because the rate constant was sampled in log space and drawn in linear space.
100 trials superposed
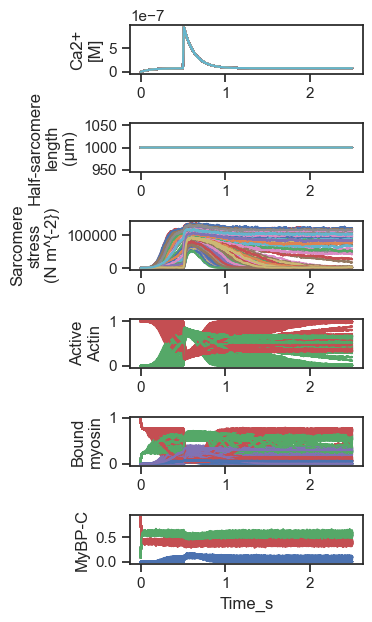
Note that for some parameter values, the muscle activated at low Ca2+ so that force rose early in the simulation and did not relax thereafter.
Data
Trace values is a 2500 x 301 tab-delimited text file with columns arranged as follows:
- Time (s)
- Ca2+ conc (M) for simulation 1
- Half-sarcomere length (nm) for simulation 1
- Stress (N m-2) for simulation 1
- Ca2+ conc (M) for simulation 2
- Half-sarcomere length (nm) for simulation 2
- Stress (N m-2) for simulation 2
- Ca2+ conc (M) for simulation 3
- Half-sarcomere length (nm) for simulation 3
- Stress (N m-2) for simulation 3
- …
- Ca2+ conc (M) for simulation 100
- Half-sarcomere length (nm) for simulation 100
- Stress (N m-2) for simulation 100
Parameter values is an Excel file where the nth row contains the parameter values for simulation n