Methods
GelBox fits the summation of Gaussian functions to the density profile using a workflow that is similar to GelBandFitter. Such mathematical function is defined as follows:

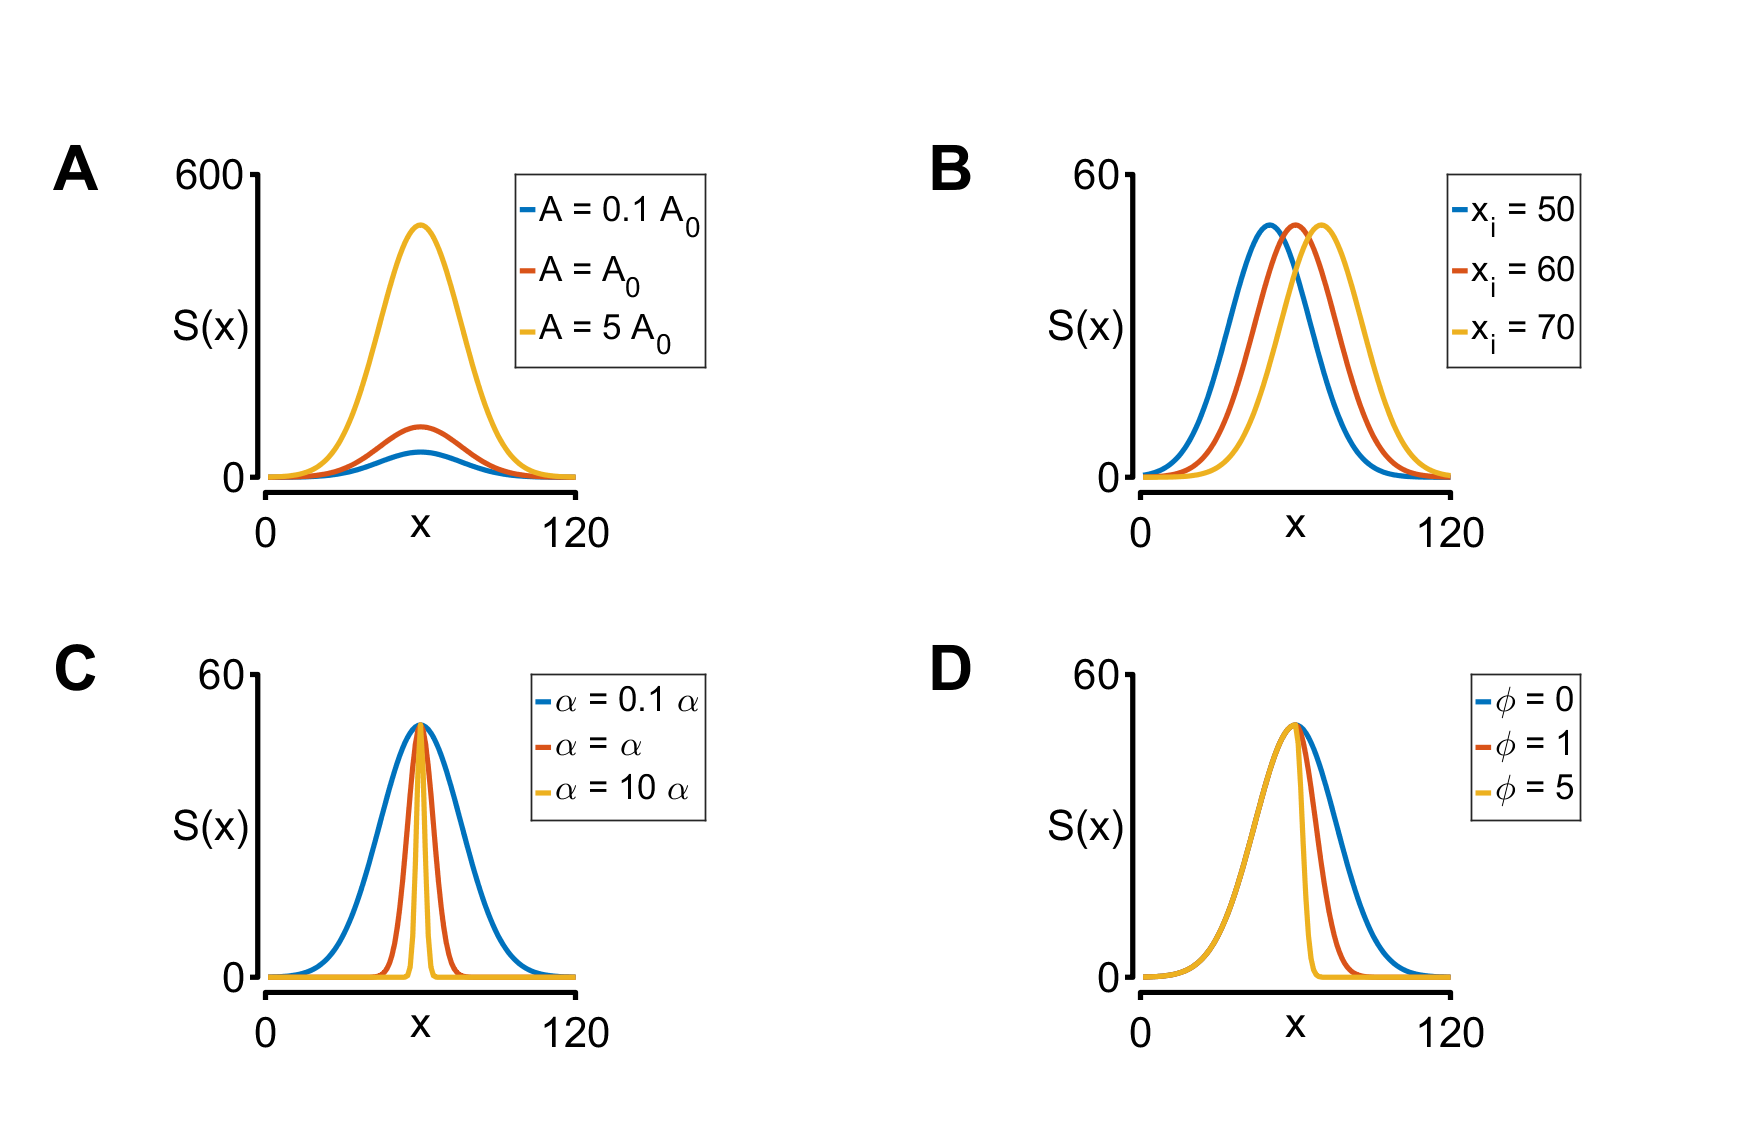
where x is the vertical position in the region of interest (ROI), n is the number of bands, Ai and xi are the peak amplitude, and its location, respectively, αi determines the width, and ϕi is the skew parameter. The equation can be used for any finite number of bands.
Each parameter alters the shape of the function. While the peak amplitude sets the maximum value, its location shifts the curve along the x direction (Panels A and B in the below figure). As the α parameter increases, the curve’s width decreases (Panel C in the below figure). A non-zero skew parameter allows the function to be asymmetric (Panel D in the below figure). GelBox estimates the width and skew parameters for the first band, then they are shared through the bands with an offset term. GelBox sets offset terms 0 assuming the proteins run in similar shapes. This assumption can be overwritten through adjustable starting parameter estimates.
GelBox adjusts the parameters for each Gaussian function until the minimum residual sum of squares of the density profile and fitted function is obtained. Such objective function is defined as follows:

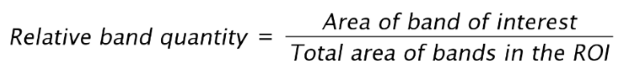
where k is the height of the ROI in pixels and D(x) is the density profile. The optimization scheme allows users to impose constraints on the parameters if required. Each Gaussian function is then numerically integrated to find the areas. Generalized relative band content expression is given as follows: