Fig_multi_x
figure_multi_x.m creates a figure that shows one or more columns of a table plotted against another column. The formatting and arrangement of the figure is defined in a separate file provided by the user in JSON format.
Source
Parts of this document were generated using a MATLAB live script
Preliminaries
% View an example table
single_data_file = "data/sim_prot_1_7_r1.txt";
d = readtable(data_file_string)
| time | m_length | m_force | sc_extension | sc_force | hs_1_pCa | hs_1_length | hs_1_command_length | hs_1_slack_length | hs_1_a_length | hs_1_m_length | hs_1_force | hs_1_titin_force | hs_1_viscous_force | hs_1_extracellular_force | hs_1_inter_hs_titin_force_effect | hs_1_a_pop_1 | hs_1_a_pop_2 | hs_1_m_pop_1 | hs_1_m_pop_2 | hs_1_m_pop_3 | hs_1_m_pop_4 | hs_1_c_pop_1 | hs_1_c_pop_2 | hs_1_c_pop_3 | |
|---|---|---|---|---|---|---|---|---|---|---|---|---|---|---|---|---|---|---|---|---|---|---|---|---|---|
| 1 | 0.001 | 1100 | 3685.3 | 0.073707 | 3685.3 | 9.23 | 1099.9 | 1100 | NaN | 1015.9 | 809.12 | 3685.3 | 4420.5 | -737.07 | 0 | 0 | 1 | 0 | 0.93499 | 0.065008 | 0 | 0 | 1 | 0 | 0 |
| 2 | 0.002 | 1100 | 4298 | 0.08596 | 4298 | 8.93 | 1099.9 | 1100 | NaN | 1015.9 | 809.12 | 4298 | 4420.2 | -122.53 | 0 | 0 | 1 | 0 | 0.88513 | 0.11487 | 0 | 0 | 1 | 0 | 0 |
| 3 | 0.003 | 1100 | 4399.9 | 0.087997 | 4399.9 | 8.76 | 1099.9 | 1100 | NaN | 1015.9 | 809.12 | 4399.9 | 4420.2 | -20.37 | 0 | 0 | 0.99986 | 0.00014468 | 0.8506 | 0.1494 | 0 | 0 | 1 | 0 | 0 |
| 4 | 0.004 | 1100 | 4416.8 | 0.088336 | 4416.8 | 8.64 | 1099.9 | 1100 | NaN | 1015.9 | 809.12 | 4416.8 | 4420.2 | -3.3865 | 0 | 0 | 0.99971 | 0.00028935 | 0.82398 | 0.17602 | 0 | 0 | 1 | 0 | 0 |
| 5 | 0.005 | 1100 | 4419.6 | 0.088392 | 4419.6 | 8.54 | 1099.9 | 1100 | NaN | 1015.9 | 809.12 | 4419.6 | 4420.2 | -0.56299 | 0 | 0 | 1 | 0 | 0.80064 | 0.19936 | 0 | 0 | 1 | 0 | 0 |
| 6 | 0.006 | 1100 | 4420.1 | 0.088401 | 4420.1 | 8.47 | 1099.9 | 1100 | NaN | 1015.9 | 809.12 | 4420.1 | 4420.2 | -0.093594 | 0 | 0 | 0.99986 | 0.00014468 | 0.78868 | 0.21132 | 0 | 0 | 1 | 0 | 0 |
| 7 | 0.007 | 1100 | 4420.1 | 0.088403 | 4420.1 | 8.41 | 1099.9 | 1100 | NaN | 1015.9 | 809.12 | 4420.1 | 4420.2 | -0.01556 | 0 | 0 | 0.99957 | 0.00043403 | 0.77758 | 0.22242 | 0 | 0 | 1 | 0 | 0 |
| 8 | 0.008 | 1100 | 4420.2 | 0.088403 | 4420.2 | 8.35 | 1099.9 | 1100 | NaN | 1015.9 | 809.12 | 4420.2 | 4420.2 | -0.0025868 | 0 | 0 | 0.99957 | 0.00043403 | 0.76553 | 0.23447 | 0 | 0 | 1 | 0 | 0 |
| 9 | 0.009 | 1100 | 4420.2 | 0.088403 | 4420.2 | 8.31 | 1099.9 | 1100 | NaN | 1015.9 | 809.12 | 4420.2 | 4420.2 | -0.00043258 | 0 | 0 | 0.99957 | 0.00043403 | 0.75309 | 0.24691 | 0 | 0 | 1 | 0 | 0 |
| 10 | 0.01 | 1100 | 4420.2 | 0.088403 | 4420.2 | 8.26 | 1099.9 | 1100 | NaN | 1015.9 | 809.12 | 4420.2 | 4420.2 | -6.9858e-05 | 0 | 0 | 0.99899 | 0.0010127 | 0.74817 | 0.25183 | 0 | 0 | 1 | 0 | 0 |
| 11 | 0.011 | 1100 | 4420.2 | 0.088403 | 4420.2 | 8.23 | 1099.9 | 1100 | NaN | 1015.9 | 809.12 | 4420.2 | 4420.2 | -1.1305e-05 | 0 | 0 | 0.99913 | 0.00086806 | 0.74093 | 0.25907 | 0 | 0 | 1 | 0 | 0 |
| 12 | 0.012 | 1100 | 4420.2 | 0.088403 | 4420.2 | 8.19 | 1099.9 | 1100 | NaN | 1015.9 | 809.12 | 4420.2 | 4420.2 | -1.9008e-06 | 0 | 0 | 0.99913 | 0.00086806 | 0.73708 | 0.26292 | 0 | 0 | 1 | 0 | 0 |
| 13 | 0.013 | 1100 | 4420.2 | 0.088403 | 4420.2 | 8.16 | 1099.9 | 1100 | NaN | 1015.9 | 809.12 | 4420.2 | 4420.2 | -3.8426e-07 | 0 | 0 | 0.99913 | 0.00086806 | 0.73293 | 0.26707 | 0 | 0 | 1 | 0 | 0 |
| 14 | 0.014 | 1100 | 4420.2 | 0.088403 | 4420.2 | 8.14 | 1099.9 | 1100 | NaN | 1015.9 | 809.12 | 4420.2 | 4420.2 | -1.0232e-07 | 0 | 0 | 0.99884 | 0.0011574 | 0.73052 | 0.26948 | 0 | 0 | 1 | 0 | 0 |
% View a simple template
template_file_1 = "templates/template_1.json";
t = readstruct(template_file_1)
t = struct with fields:
        layout: [1x1 struct]
     x_display: [1x1 struct]
    formatting: [1x1 struct]
        panels: [1x1 struct]
{
    "layout":
    {
        "fig_width": 3.5,
        "padding_left": 1,
        "padding_right": 1,
        "padding_top": [0.2, 0.05],
        "padding_bottom": [0.05, 0.5],
        "x_to_y_ratio": 2
    },
    "x_display":{
        "global_x_field": "time",
        "label": "Time (s)"
    },
    "formatting":
    {
        "label_font_size": 9,
        "x_axis_offset": 0.1,
        "x_label_offset": -0.45,
        "x_tick_length": 0.1,
        "x_tick_label_vertical_offset": -0.12,
        "y_axis_offset": 0.2,
        "y_label_offset": -0.5,
        "y_tick_length": 0.1,
        "y_tick_label_horizontal_offset": -0.16,
        "tick_font_size": 9,
        "legend_font_size": 7,
        "legend_alignment": "top_left",
        "legend_position": [1.2, 1.0]
    },
    "panels":
    [
        {
            "column": 1,
            "y_info":
            {
                "label": "Stress\n(kN^{-2})",
                "series":
                [

                    {
                        "field": "m_force"
                    }
                ]
            }
        }
    ]
}
A single panel figure
% Create a figure
figure_multi_x(single_data_file, template_file_1)
Plot data from multiple files on a single panel
% Plot three tables with the same format
multiple_data_files = [ ...
    "data/sim_prot_1_1_r1.txt", ...
    "data/sim_prot_1_3_r1.txt", ...
    "data/sim_prot_1_5_r1.txt"];

figure_multi_x(multiple_data_files, template_file_1)
Plot multiple panels
Add new panels to the figure by inserting new elements into the panel array. The column variable defines where the panel will be placed.
template_file_2 = "templates/template_2.json";

figure_multi_x(single_data_file, template_file_2)
{
    <SNIP>

    "panels":
    [
        {
            "column": 1,
            "y_info":
            {
                "label": "Stress\n(kN^{-2})",
                "series":
                [
                    {
                        "field": "m_force"
                    }
                ]
            }
        },
        {
            "column": 2,
            "y_info":
            {
                "label": "Half-\nsarcomere\nlength\n(nm)",
                "series":
                [
                    {
                        "field": "hs_1_length"
                    }
                ]
            }
        }
    ]
}
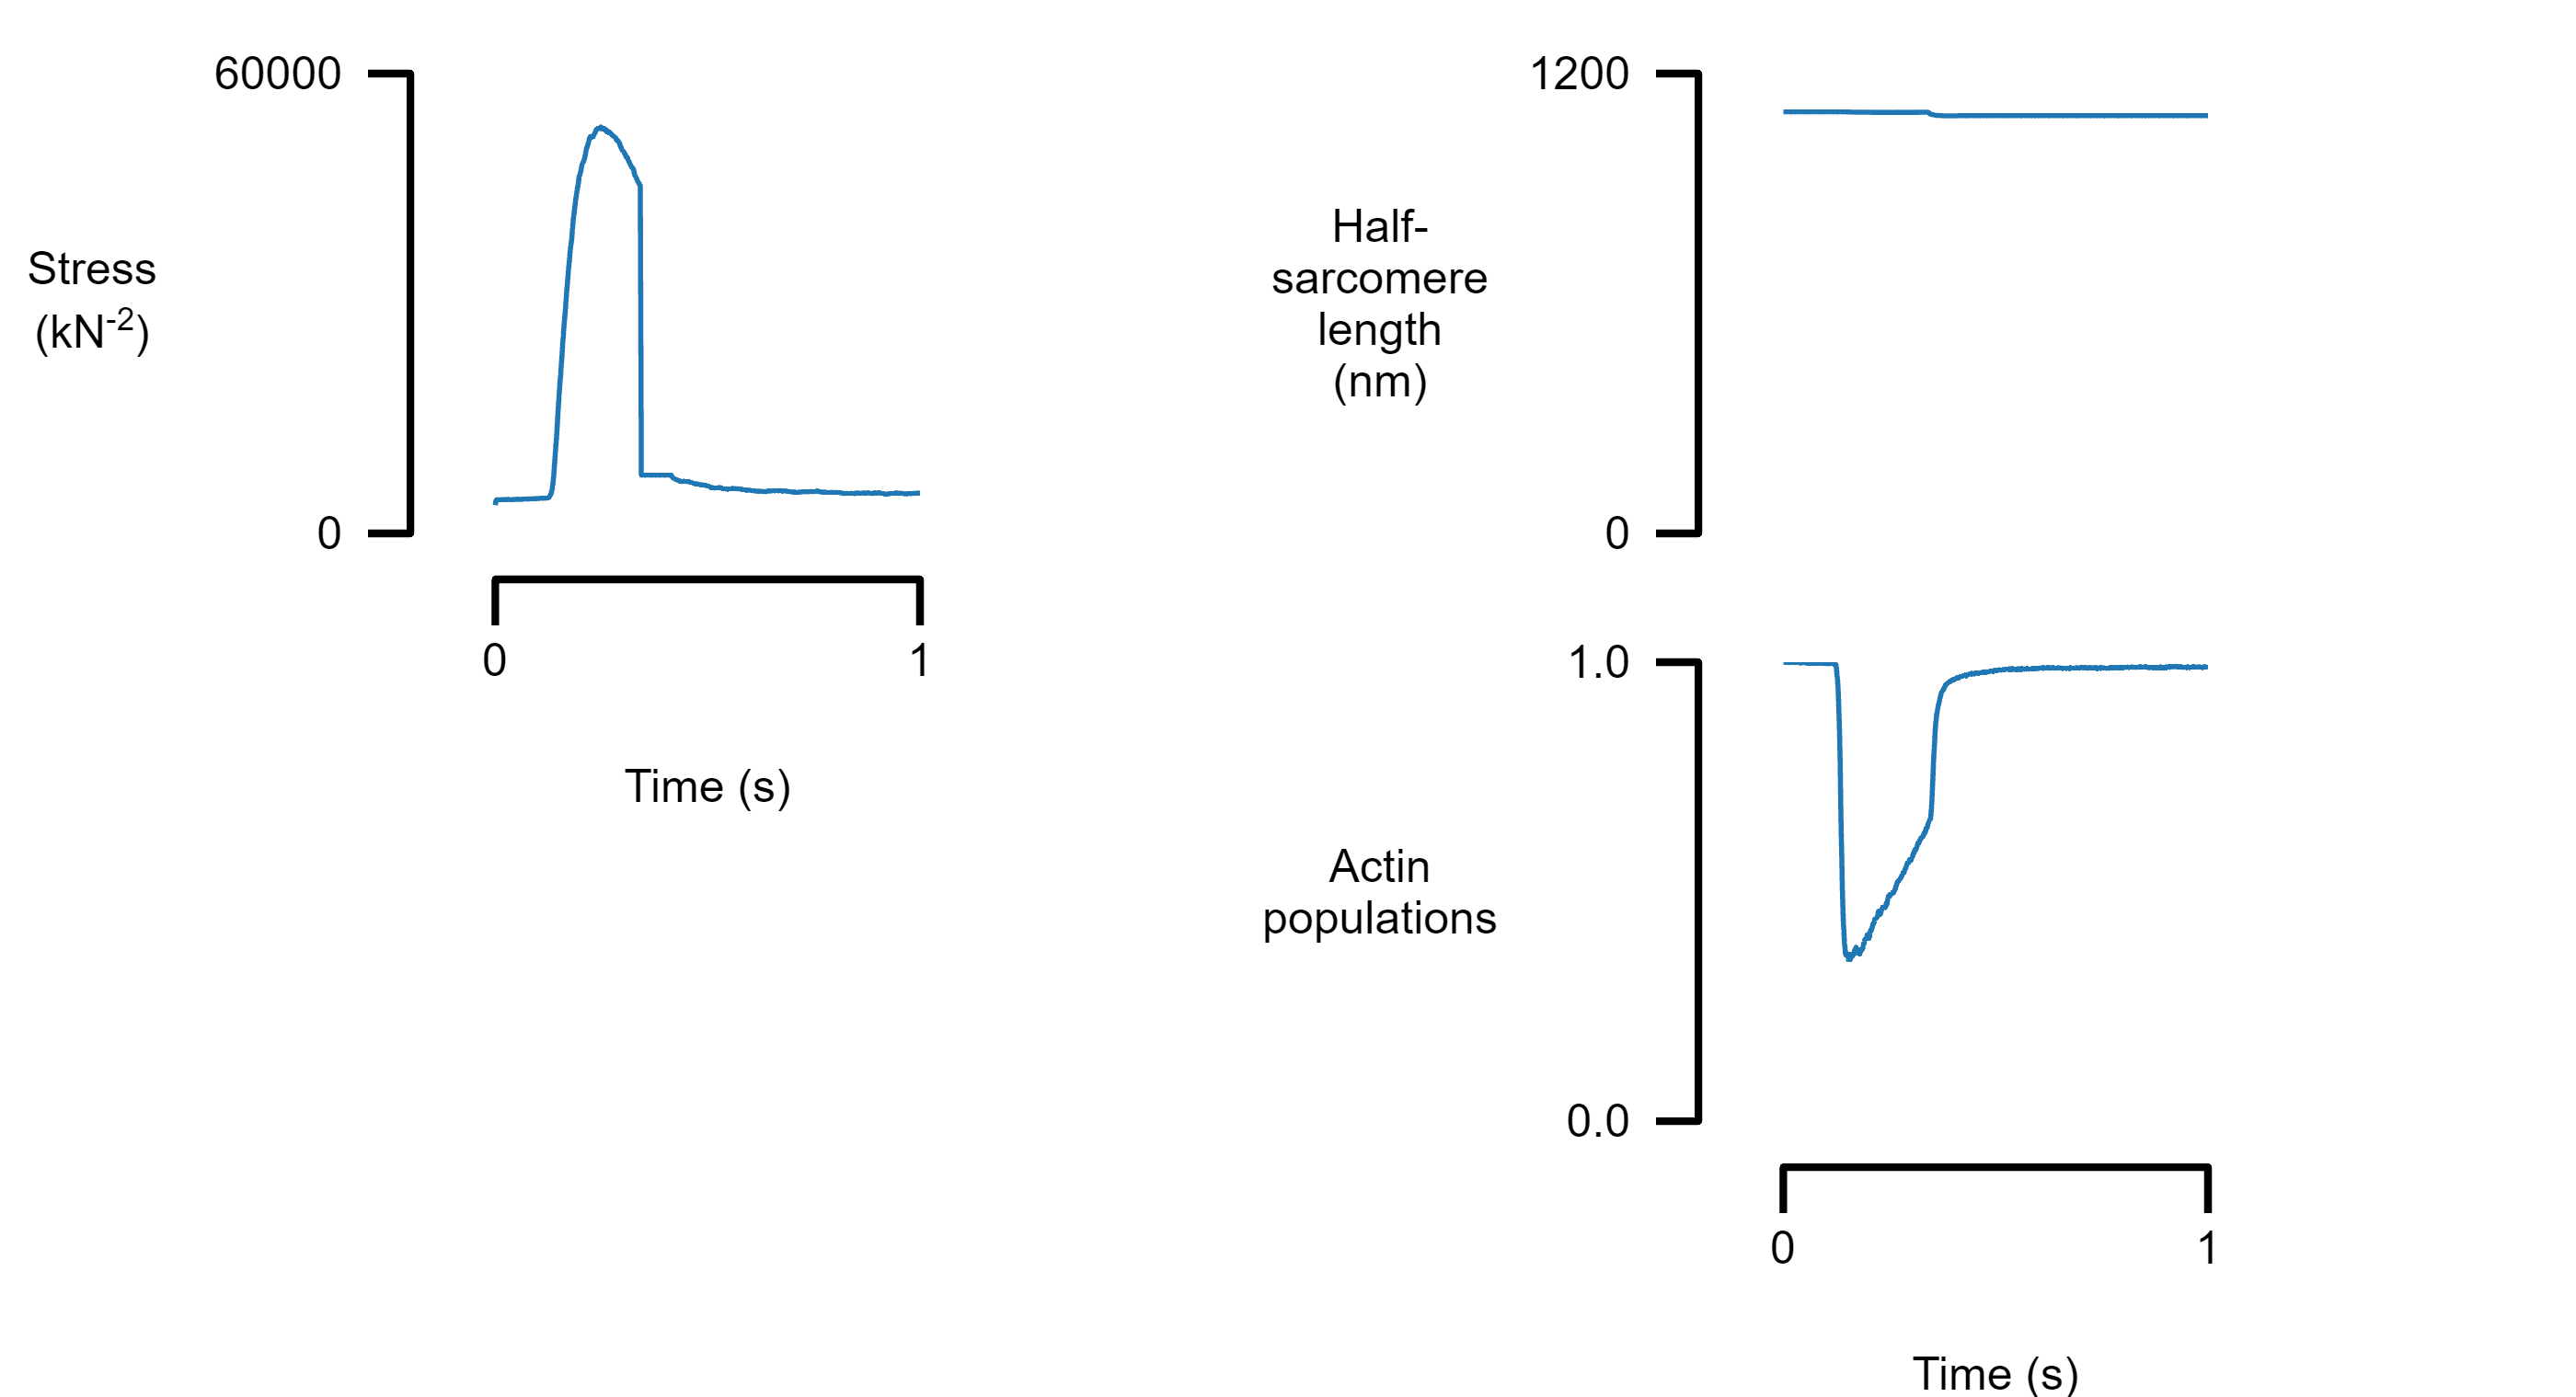
Plot multiple rows
Add another panel to column 2 by inserting a new element with the appropriate column label. Only the bottom panel in each column shows the x axis.
template_file_3 = "templates/template_3.json";

figure_multi_x(single_data_file, template_file_3)
{
    <SNIP>

    "panels":
    [
        {
            "column": 1,
            "y_info":
            {
                "label": "Stress\n(kN^{-2})",
                "series":
                [
                    {
                        "field": "m_force"
                    }
                ]
            }
        },
        {
            "column": 2,
            "y_info":
            {
                "label": "Half-\nsarcomere\nlength\n(nm)",
                "series":
                [
                    {
                        "field": "hs_1_length"
                    }
                ]
            }
        },
        {
            "column": 2,
            "y_info":
            {
                "label": "Actin\npopulations",
                "series":
                [

                    {
                        "field": "hs_1_a_pop_1"
                    }
                ]
            }
        }
    ]
}
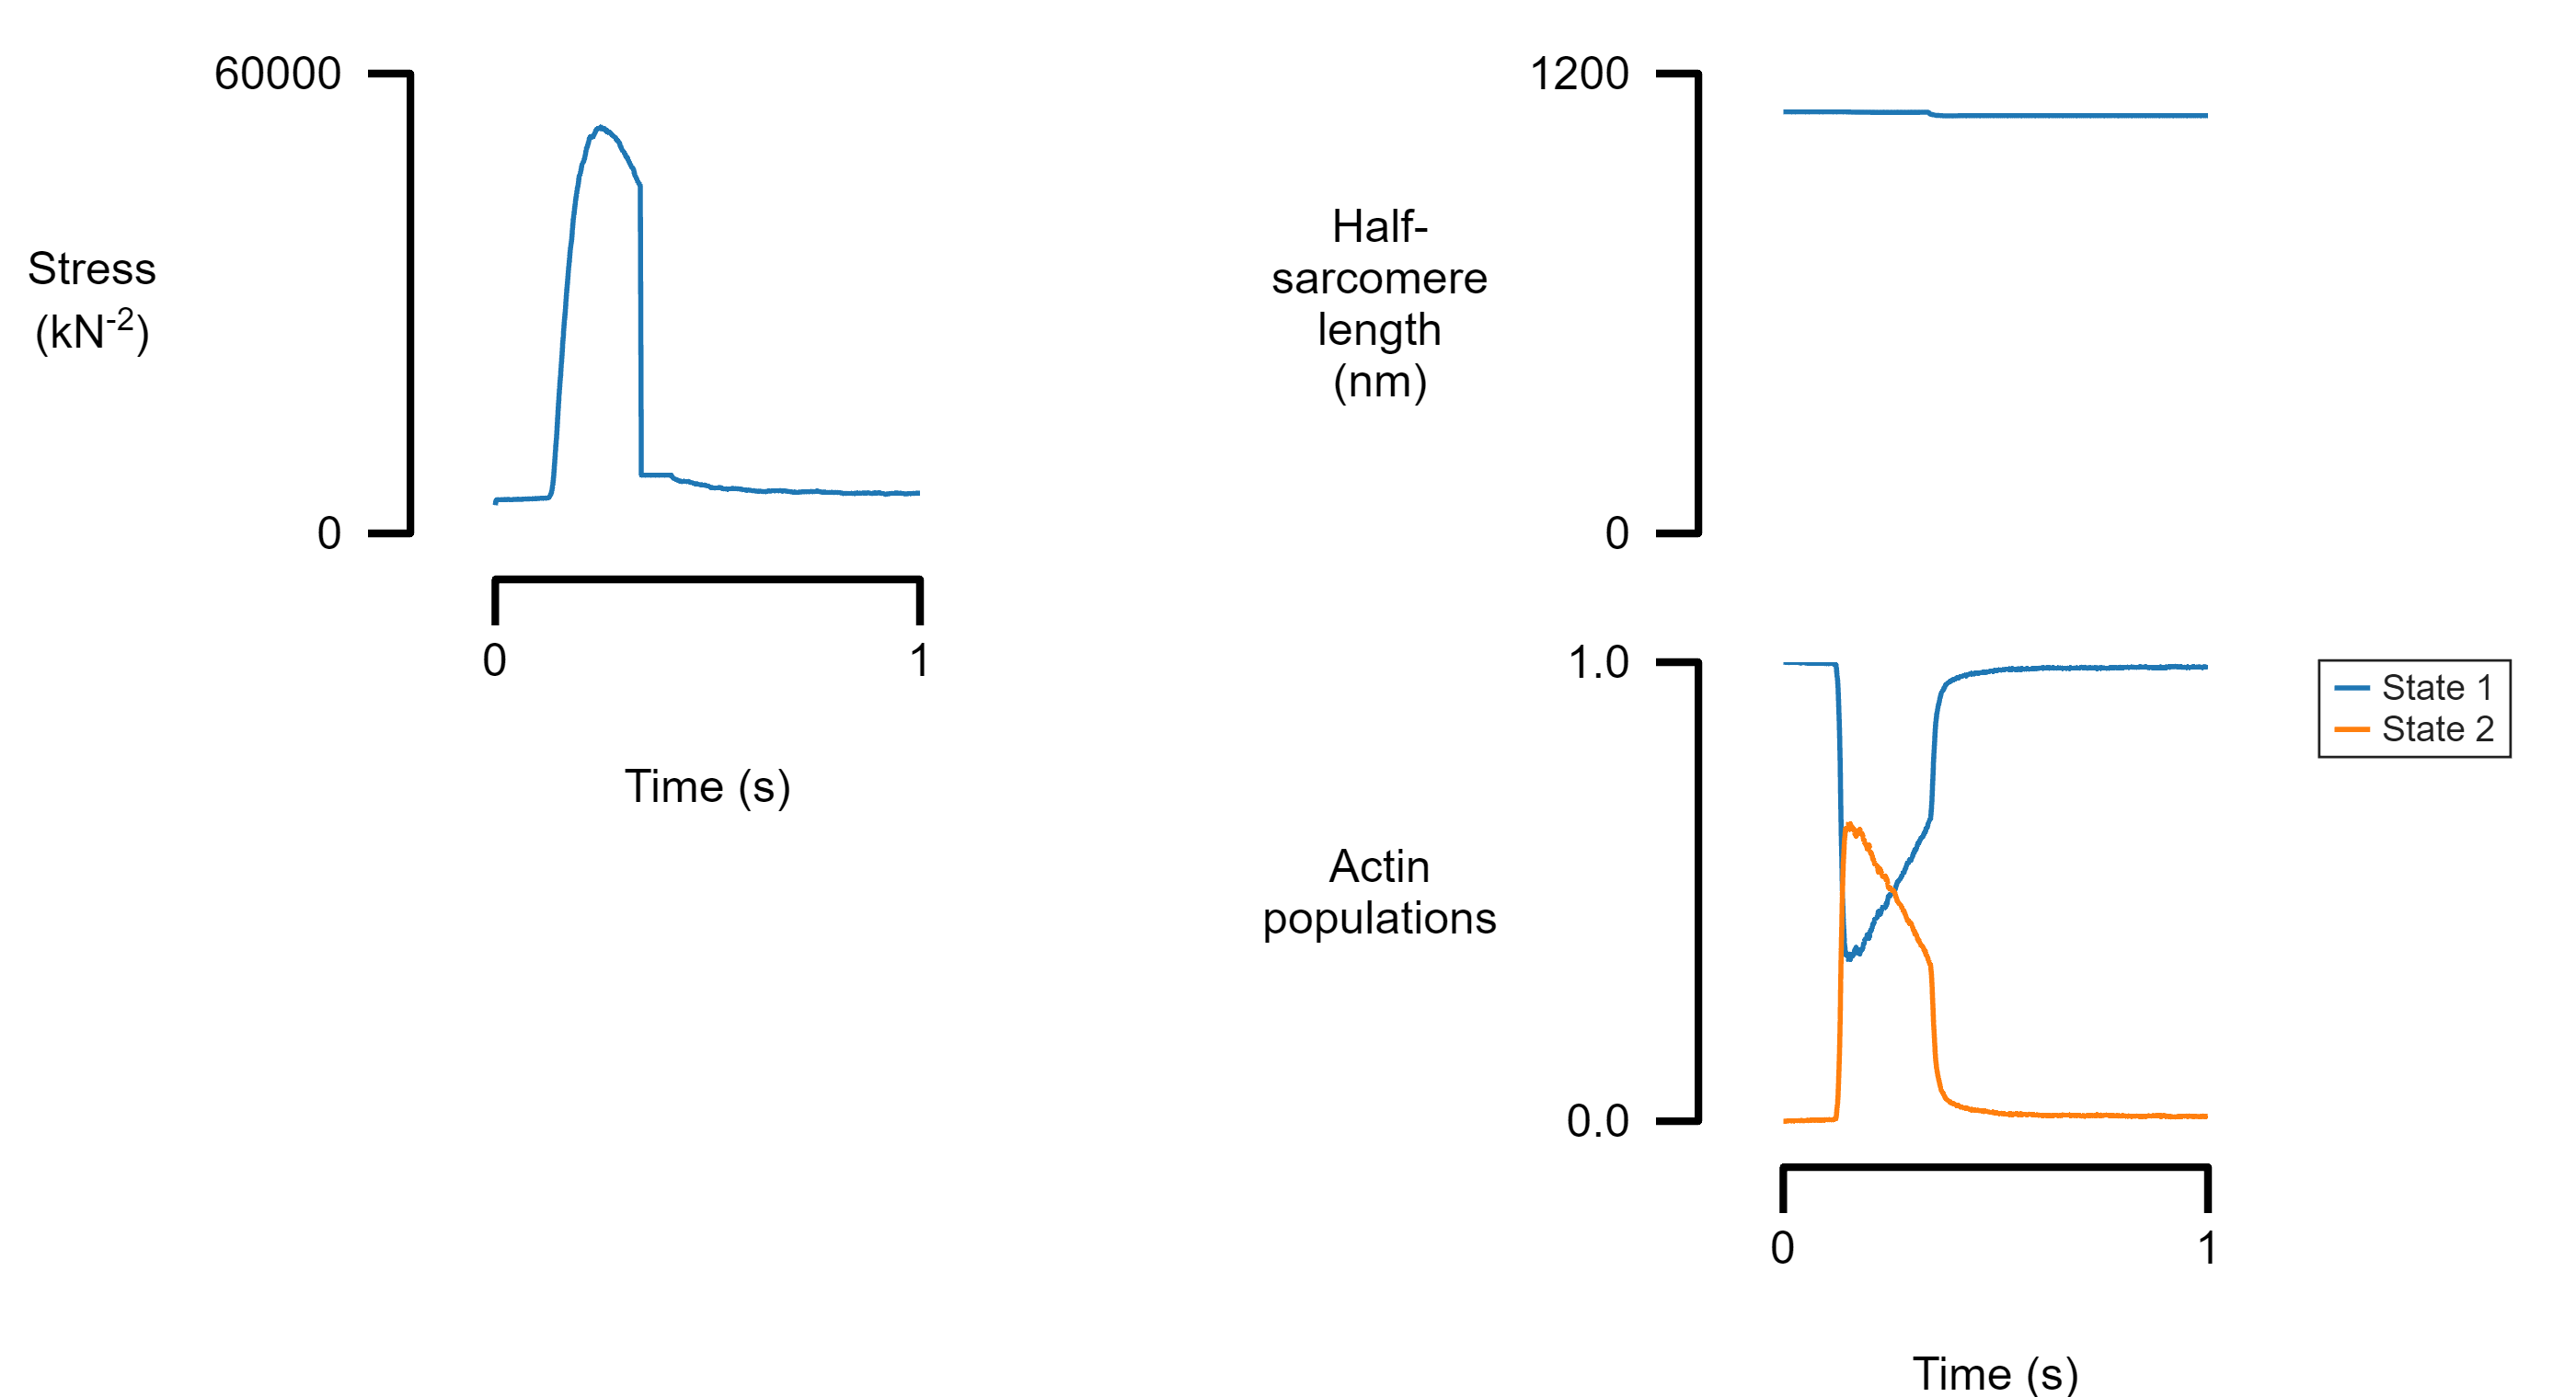
Plot multiple traces from the same data file
Each panel can show more than one trace. If a field_label is provided, a legend will be added to the panel.
template_file_4 = "templates/template_4.json";

figure_multi_x(single_data_file, template_file_4)
{

    <snip>

    "panels":
    [
        <snip>
         {
            "column": 2,
            "y_info":
            {
                "label": "Actin\npopulations",
                "series":
                [

                    {
                        "field": "hs_1_a_pop_1",
                        "field_label": "State 1"
                    },
                    {
                        "field": "hs_1_a_pop_2",
                        "field_label": "State 2"
                    }
                ]
            }
        }
    ]
}
Plotting a multi panel results for a publication
With this:
figure_multi_x(data_file, template_file)