Multipanel Categorical
Examples
- First import the
multi_panel_catfunction from thePyCMLutillibrary.>>> from PyCMLutil.plots.multi_panel_cat import multi_panel_cat_from_flat_data as mplcNote
Below examples are based on the data spreadsheet stored on the github repository in the following directory path:
<github_repo>/demos/data. Template files are also stored on<github_repo>/demos/templates. - Then assign the path to the data spreadsheet that you want to read data from.
>>> data_path = `data/valvular_disease.xlsx`
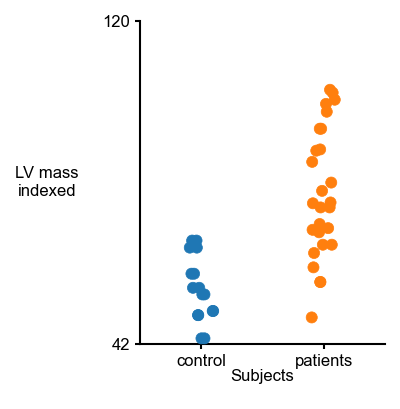
Example 1: 1 by 1 multipanel stripplot.
>>> template_path = `demos/templates/1X1_strip_valvular.json`
>>> output_image_path = `<path_to>/1X1_strip_valvular.png`
>>> mplc(data_file_string = data_path,
... template_file_string = template_path,
... output_image_file_string= output_image_path)
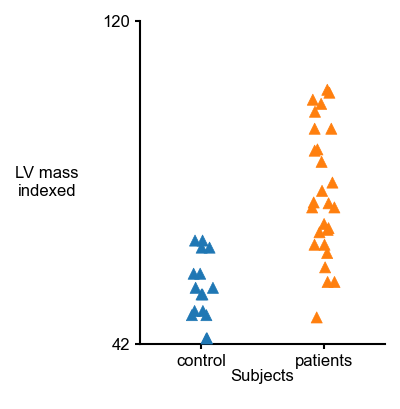
Example 2: 1 by 1 multipanel stripplot with modified markers shape.
>>> template_path = `templates/1X1_strip_hue_valvular_markers.json`
>>> output_image_path = `<path_to>/1X1_strip_valvular_markers.png`
>>> mplc(data_file_string = data_path,
... template_file_string = template_path,
... output_image_file_string= output_image_path)
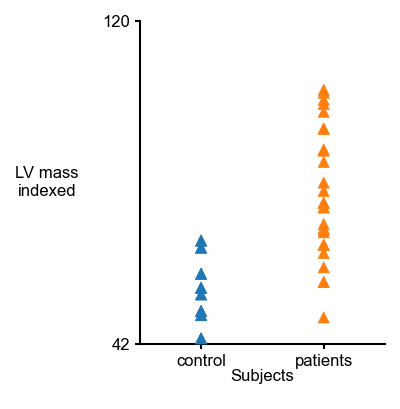
Example 3: 1 by 1 multipanel stripplot with no jitter.
>>> template_path = `templates/1X1_strip_hue_valvular_no_jitter.json`
>>> output_image_path = `<path_to>/1X1_strip_hue_valvular_no_jitter.png`
>>> mplc(data_file_string = data_path,
... template_file_string = template_path,
... output_image_file_string= output_image_path)
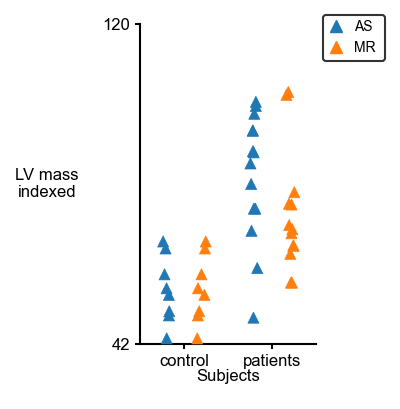
Example 4: 1 by 1 multipanel stripplot with hue.
>>> template_path = `templates/1X1_strip_valvular_hue.json`
>>> output_image_path = `<path_to>/1X1_strip_valvular_hue.png/`
>>> mplc(data_file_string = data_path,
... template_file_string = template_path,
... output_image_file_string= output_image_path)
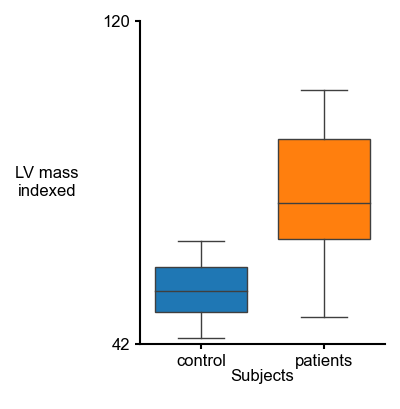
Example 5: 1 by 1 multipanel boxplot.
>>> template_path = `templates/1X1_box_valvular.json`
>>> output_image_path = `<path_to>/1X1_box_valvular.png`
>>> mplc(data_file_string = data_path,
... template_file_string = template_path,
... output_image_file_string= output_image_path)
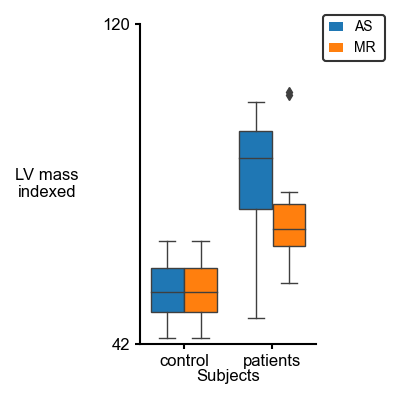
Example 6: 1 by 1 multipanel boxplot with hue.
>>> template_path = `templates/1X1_box_valvular_hue.json`
>>> output_image_path = `<path_to>/1X1_box_valvular_hue.png`
>>> mplc(data_file_string = data_path,
... template_file_string = template_path,
... output_image_file_string= output_image_path)
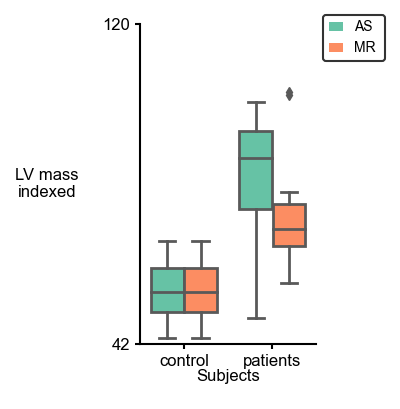
Example 7: 1 by 1 multipanel boxplot with modified line width and box palette.
>>> template_path = `templates/1X1_box_valvular_modified_style.json`
>>> output_image_path = `<path_to>/1X1_box_valvular_modified_style.png`
>>> mplc(data_file_string = data_path,
... template_file_string = template_path,
... output_image_file_string= output_image_path)
Now let’s try another type of plot for categorical data.
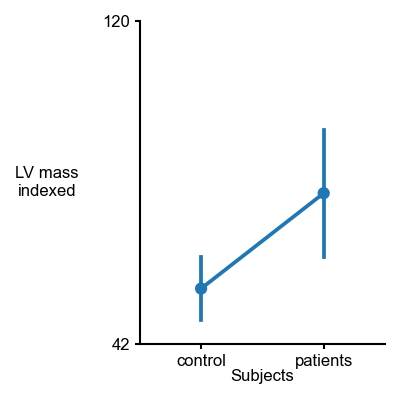
Example 8: 1 by 1 multipanel pointplot.
>>> template_path = `templates/1X1_point_valvular.json`
>>> output_image_path = `<path_to>/1X1_point_valvular.png`
>>> mplc(data_file_string = data_path,
... template_file_string = template_path,
... output_image_file_string= output_image_path)
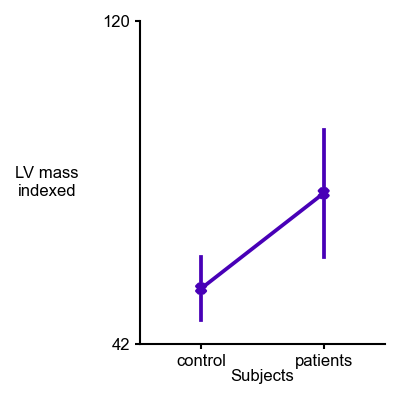
Example 9: 1 by 1 multipanel pointplot with modified marker shape and new palette.
>>> template_path = `templates/1X1_point_valvular_markers.json`
>>> output_image_path = `<path_to>/1X1_point_valvular_markers.png`
>>> mplc(data_file_string = data_path,
... template_file_string = template_path,
... output_image_file_string= output_image_path)
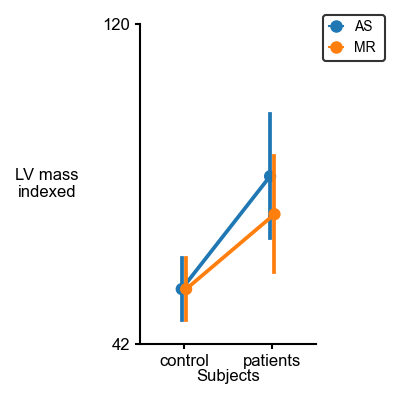
Example 10: 1 by 1 multipanel pointplot with hue.
>>> template_path = `templates/1X1_point_valvular_hue.json`
>>> output_image_path = `<path_to>/1X1_point_valvular_hue.png`
>>> mplc(data_file_string = data_path,
... template_file_string = template_path,
... output_image_file_string = output_image_path)
Now let’s combine the categorical plotting functions and make multipanel plots.
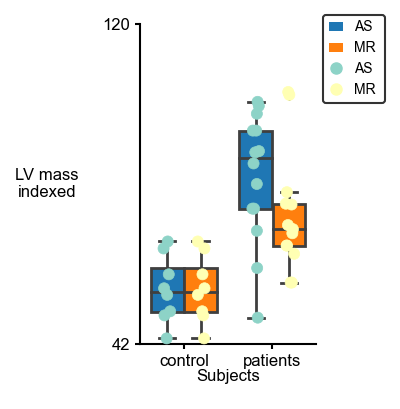
Example 11: 1 by 1 multipanel boxplot along stripplot together with hue.
>>> template_path = `templates/1X1_box_strip_valvular.json`
>>> output_image_path = `<path_to>/1X1_box_strip_valvular.png`
>>> mplc(data_file_string = data_path,
... template_file_string = template_path,
... output_image_file_string = output_image_path)
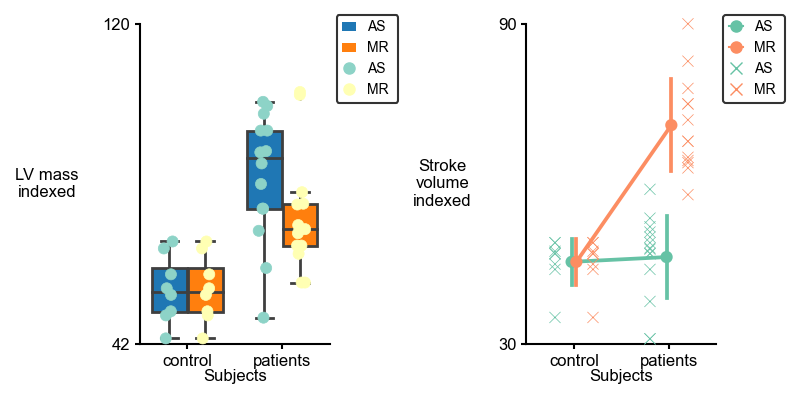
Example 12: 1 by 2 multipanel plots in shapes of boxplot and pointplot with raw data shown with stripplot.
>>> template_path = `templates/1X2_box_point_strip_valvular.json`
>>> output_image_path = `<path_to>/1X2_box_point_strip_valvular.png`
>>> mplc(data_file_string = data_path,
... template_file_string = template_path,
... output_image_file_string = output_image_path)
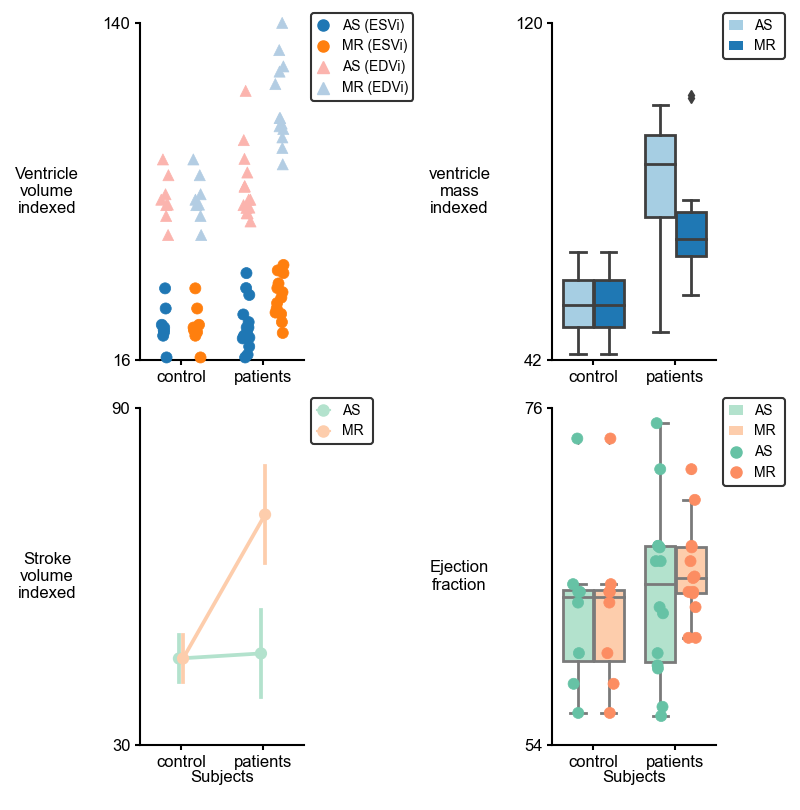
Example 8: 2 by 2 multipanel plots with different type of plots.
>>> template_path = `templates/4X4_multiple_valvular.json`
>>> output_image_path = `<path_to>/4X4_multiple_valvular.png`
>>> mplc(data_file_string = data_path,
... template_file_string = template_path,
... output_image_file_string = output_image_path)