Multipanel Numerical
- First import the
multi_panelfunction from thePyCMLutillibrary.
>>> from PyCMLutil.plots.multi_panel import multi_panel_from_flat_data as mpl
Below examples are based on data spreadsheets stored on the github repository in the following directory path: <github_repo>/demos/data. Template files are also stored on <github_repo>/demos/templates.
- Then assign the path to the data spreadsheet that you want to read data from.
>>> data_path = `data/test_data.xlsx`
Example 1: Calling the function without any template file.
>>> output_image_path = `<path_to>/no_temp.png`
>>> mpl(data_file_string = data_path,
... output_image_file_string = output_image_path)
Example 2: 1 by 1 multipanel plot by assigning only one panel data.
>>> template_path = `templates/1X1_mpl.json`
>>> output_image_path = `<path_to>/1X1_mpl.png`
>>> mpl(data_file_string = data_path,
... template_file_string = template_path,
... output_image_file_string = output_image_path)
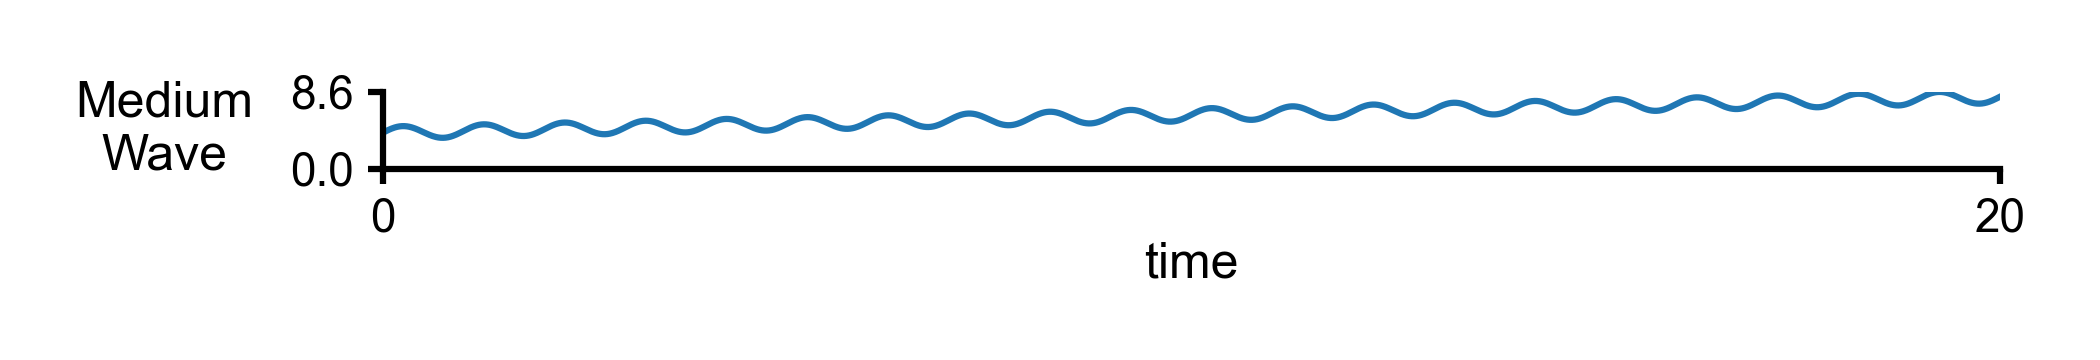
Example 3: 1 by 1 multipanel plot from Example 2, but wider.
>>> template_path = `templates/1X1_wide.json`
>>> output_image_path = `<path_to>/1X1_wide.png`
>>> mpl(data_file_string = data_path,
... template_file_string = template_path,
... output_image_file_string = output_image_path)
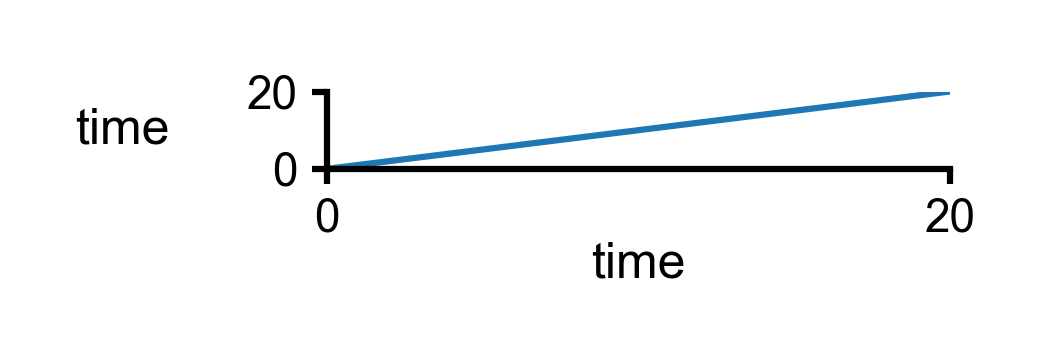
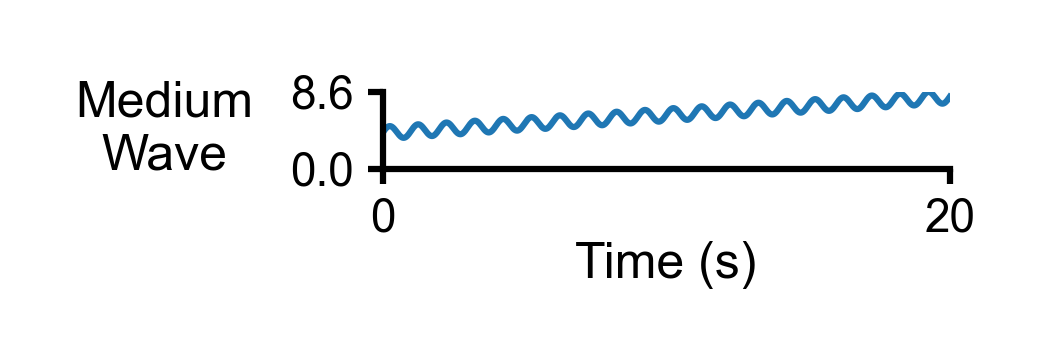
Example 4: 1 by 1 multipanel plot from Example 2, with x-axis inputs.
>>> template_path = `templates/1X1_x_display.json`
>>> output_image_path = `<path_to>/1X1_x_display.png`
>>> mpl(data_file_string = data_path,
... template_file_string = template_path,
... output_image_file_string = output_image_path)
Example 5: 1 by 1 multipanel plot from Example 3, with modified height.
>>> template_path = `templates/1X1_height.json`
>>> output_image_path = `<path_to>/1X1_height.png`
>>> mpl(data_file_string = data_path,
... template_file_string = template_path,
... output_image_file_string = output_image_path)
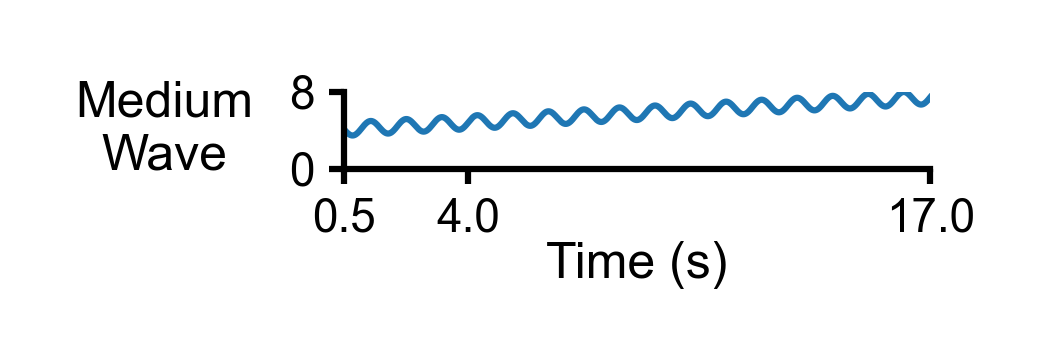
Example 6: 1 by 1 multipanel plot from Example 4, with modified x-ticks.
>>> template_path = `templates/1X1_x_ticks.json`
>>> output_image_path = `<path_to>/1X1_x_ticks.png`
>>> mpl(data_file_string = data_path,
... template_file_string = template_path,
... output_image_file_string = output_image_path)
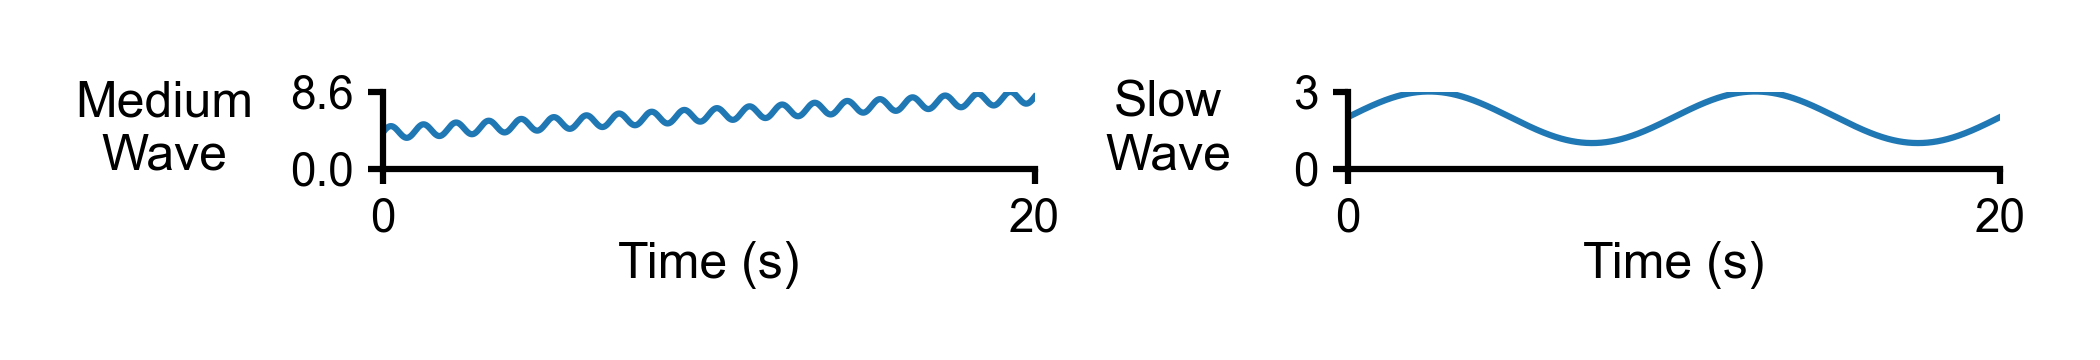
Example 7: 1 by 2 multipanel plots.
>>> template_path = `templates/1X2_wide.json`
>>> output_image_path = `<path_to>/1X2_wide.png`
>>> mpl(data_file_string = data_path,
... template_file_string = template_path,
... output_image_file_string = output_image_path)
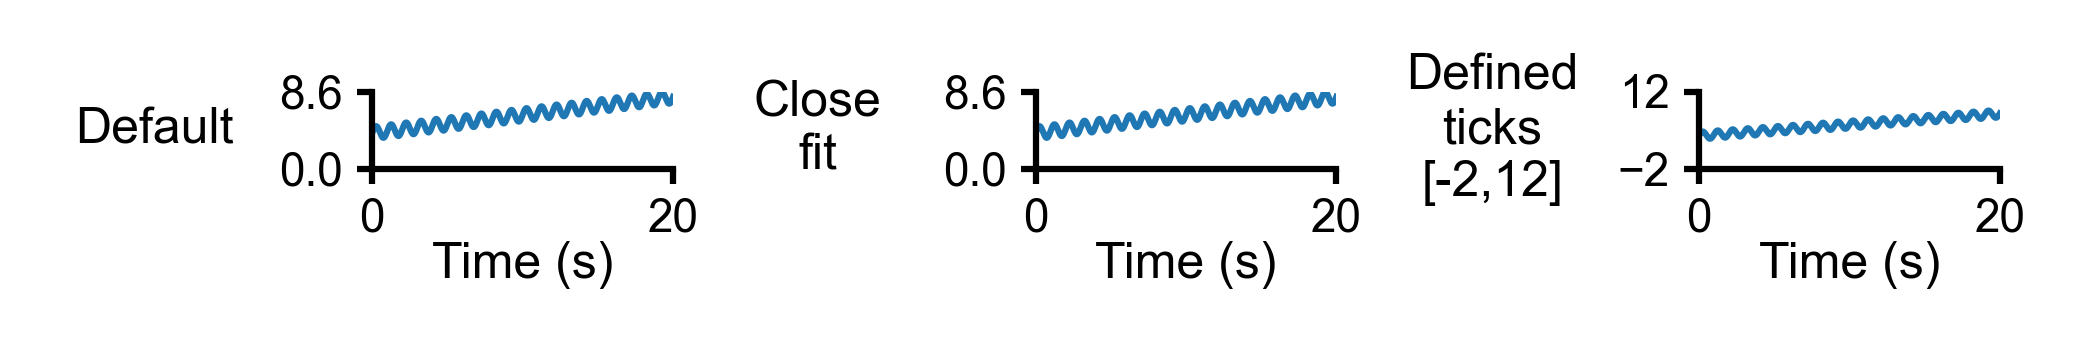
Example 8: 1 by 3 multipanel plots.
>>> template_path = `templates/1X3_wide.json`
>>> output_image_path = `<path_to>/1X3_wide.png`
>>> mpl(data_file_string = data_path,
... template_file_string = template_path,
... output_image_file_string = output_image_path)
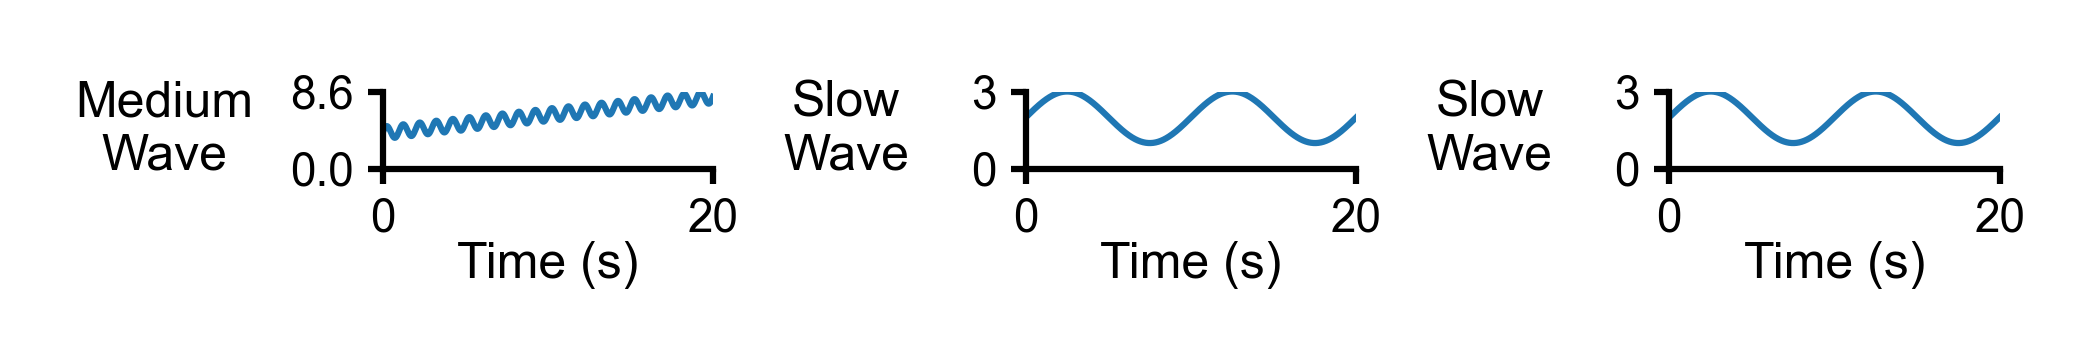
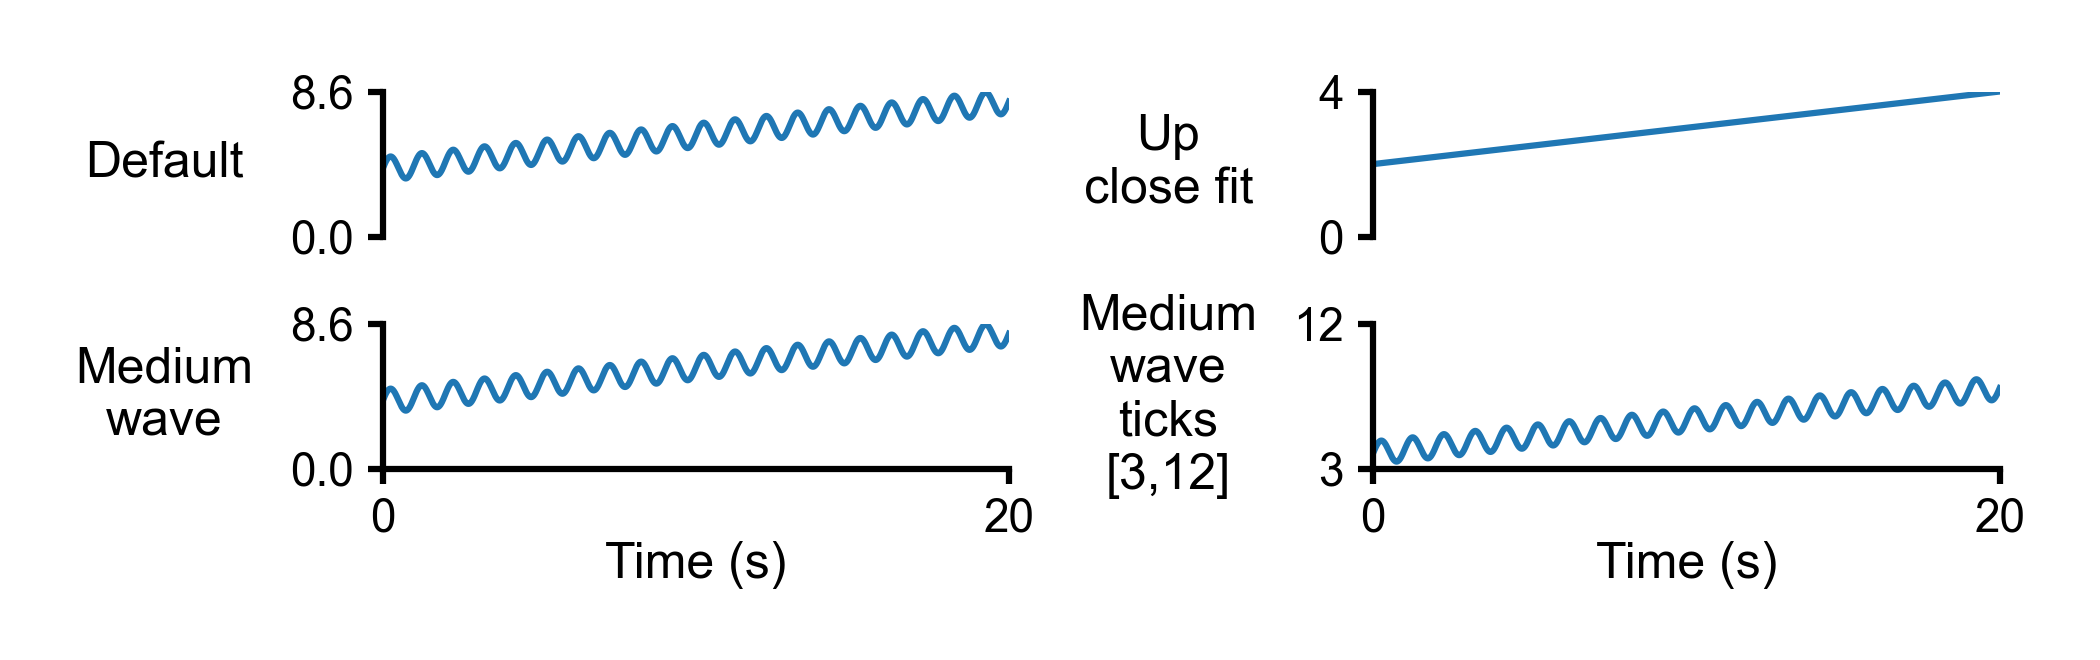
Example 9: 1 by 3 multipanel plots with different types of scaling for y-axis.
>>> template_path = `templates/1X3_wide_scaling.json`
>>> output_image_path = `<path_to>/1X3_wide_scaling.png`
>>> mpl(data_file_string = data_path,
... template_file_string = template_path,
... output_image_file_string = output_image_path)
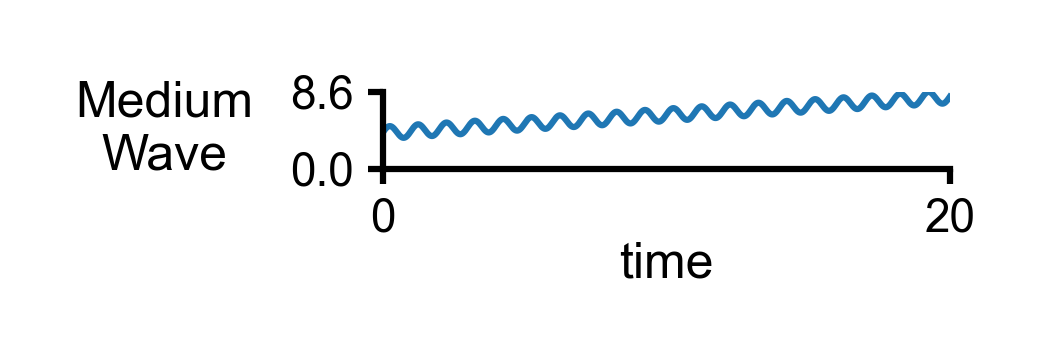
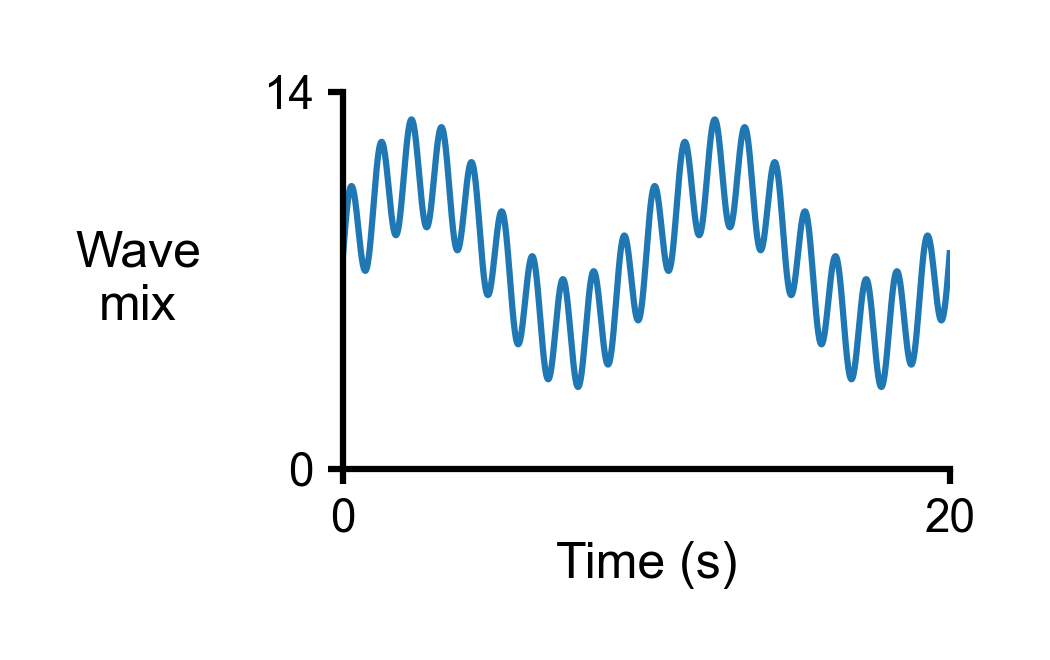
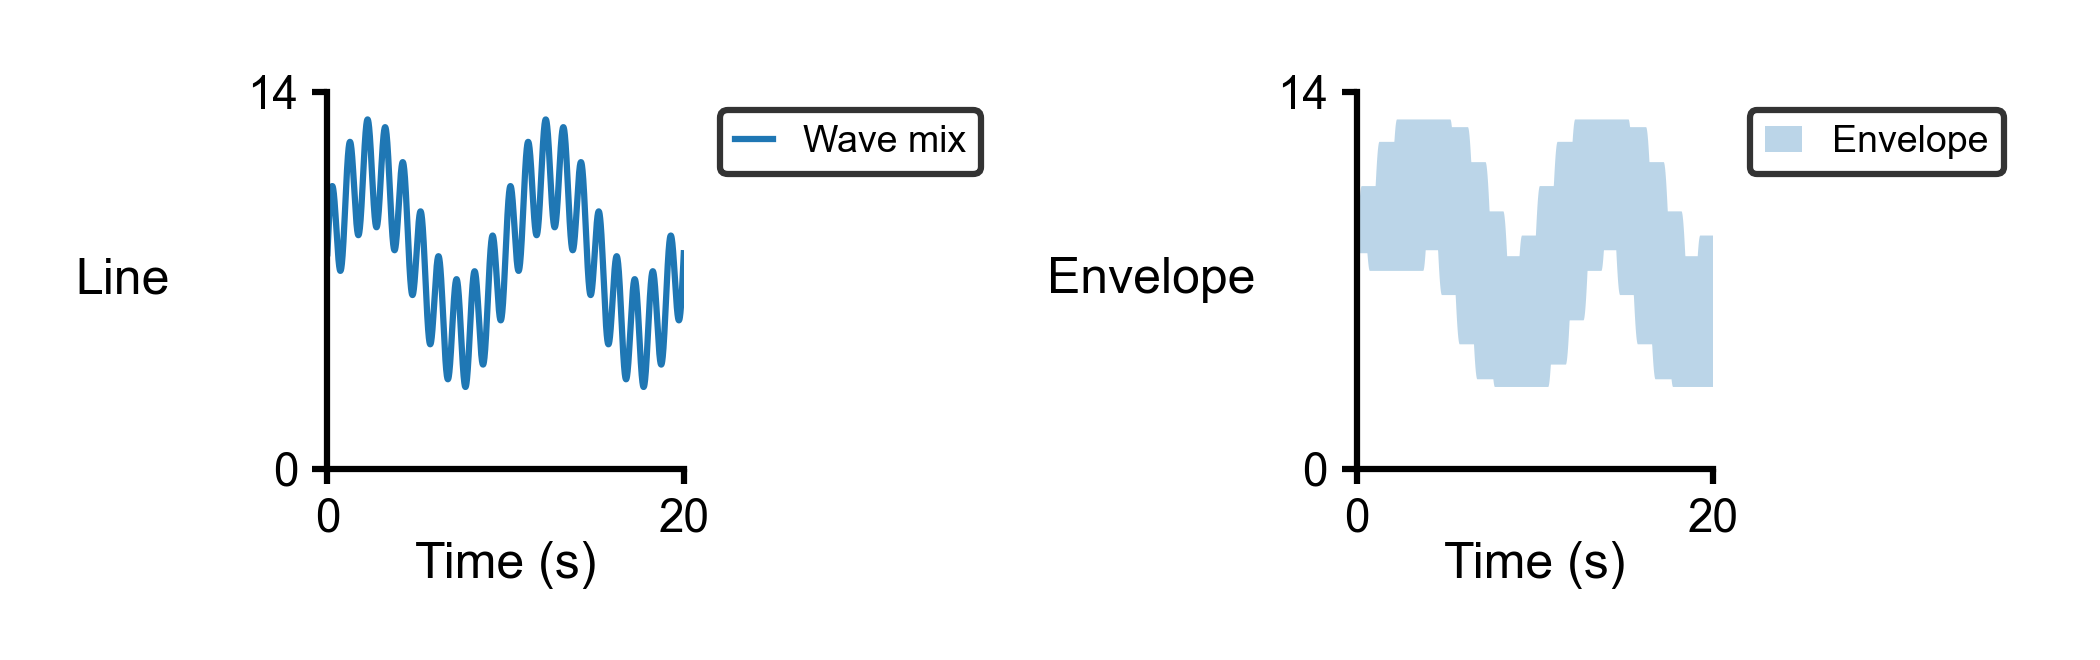
Example 10: 1 by 2 multipanel plots with second plot showing the envlope of responses.
>>> template_path = `templates/1X2_envelope.json`
>>> output_image_path = `<path_to>/1X2_envelope.png`
>>> mpl(data_file_string = data_path,
... template_file_string = template_path,
... output_image_file_string = output_image_path)
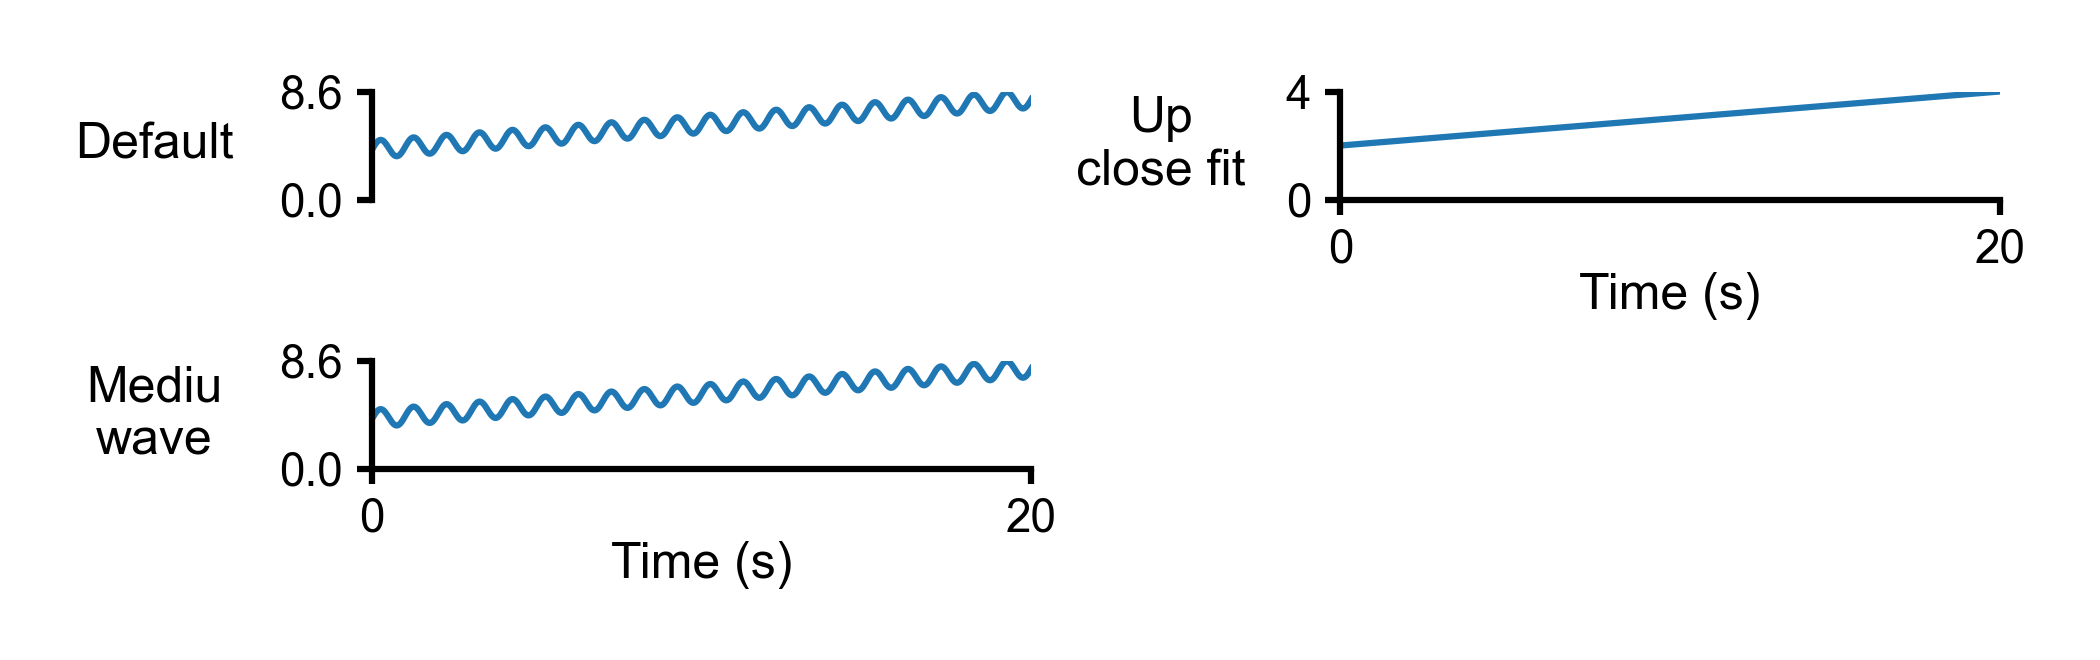
Example 11: partial 2 by 2 multipanel plots.
>>> template_path = `templates/2X2_partial.json`
>>> output_image_path = `<path_to>/2X2_partial.png`
>>> mpl(data_file_string = data_path,
... template_file_string = template_path,
... output_image_file_string = output_image_path)
Example 12: Full 2 by 2 multipanel plots.
>>> template_path = `templates/2X2_full.json`
>>> output_image_path = `<path_to>/2X2_full.png`
>>> mpl(data_file_string = data_path,
... template_file_string = template_path,
... output_image_file_string = output_image_path)
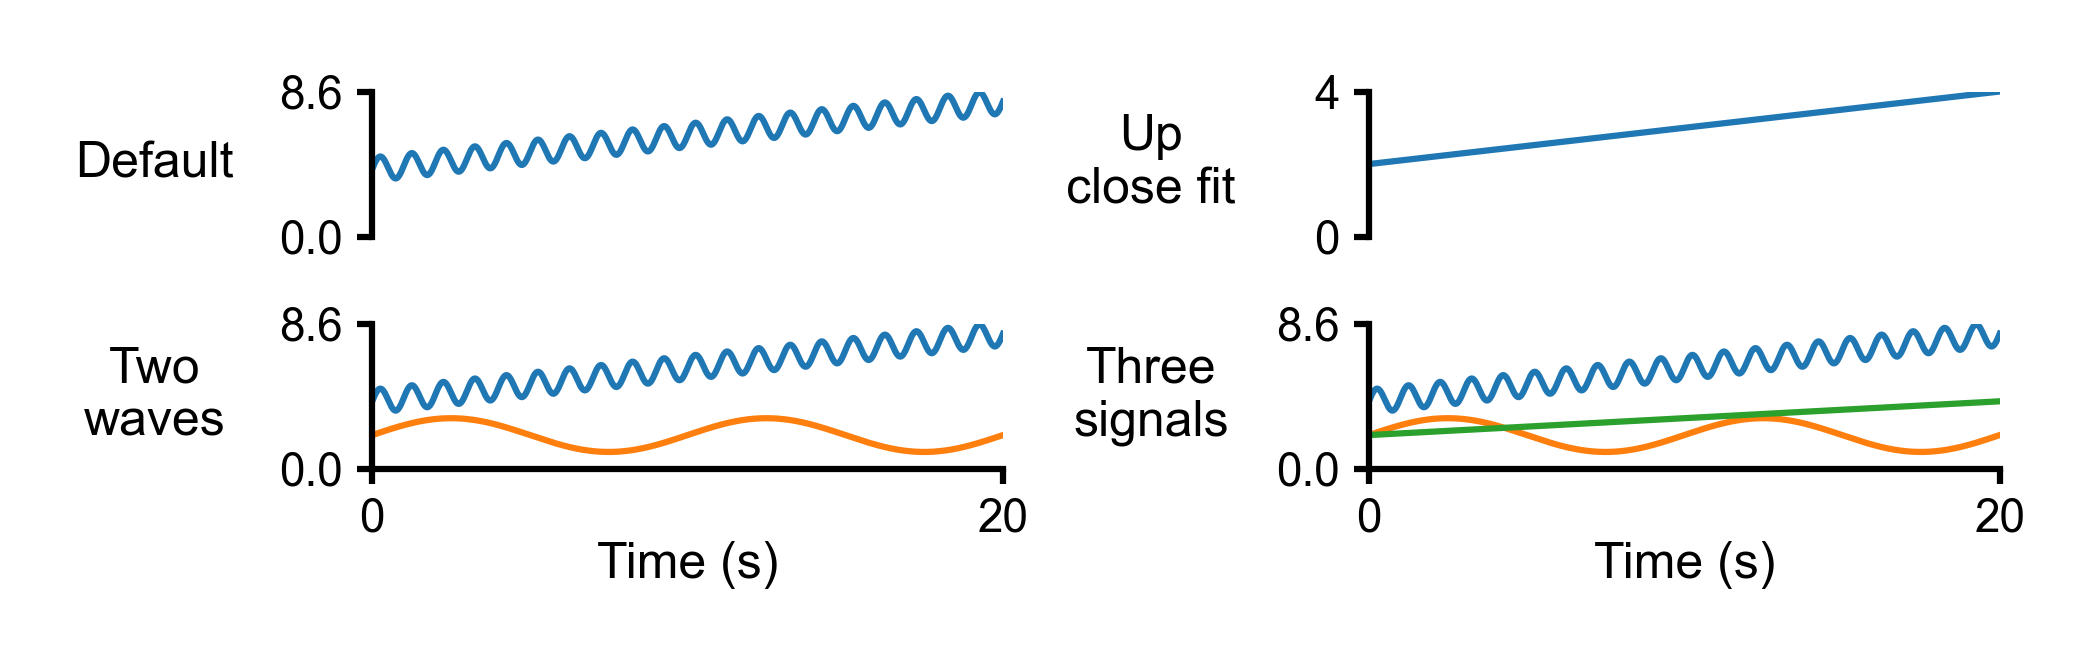
Example 13: 2 by 2 multipanel plots with multi series.
>>> template_path = `templates/2X2_multi_series.json`
>>> output_image_path = `<path_to>/2X2_multi_series.png`
>>> mpl(data_file_string = data_path,
... template_file_string = template_path,
... output_image_file_string = output_image_path)
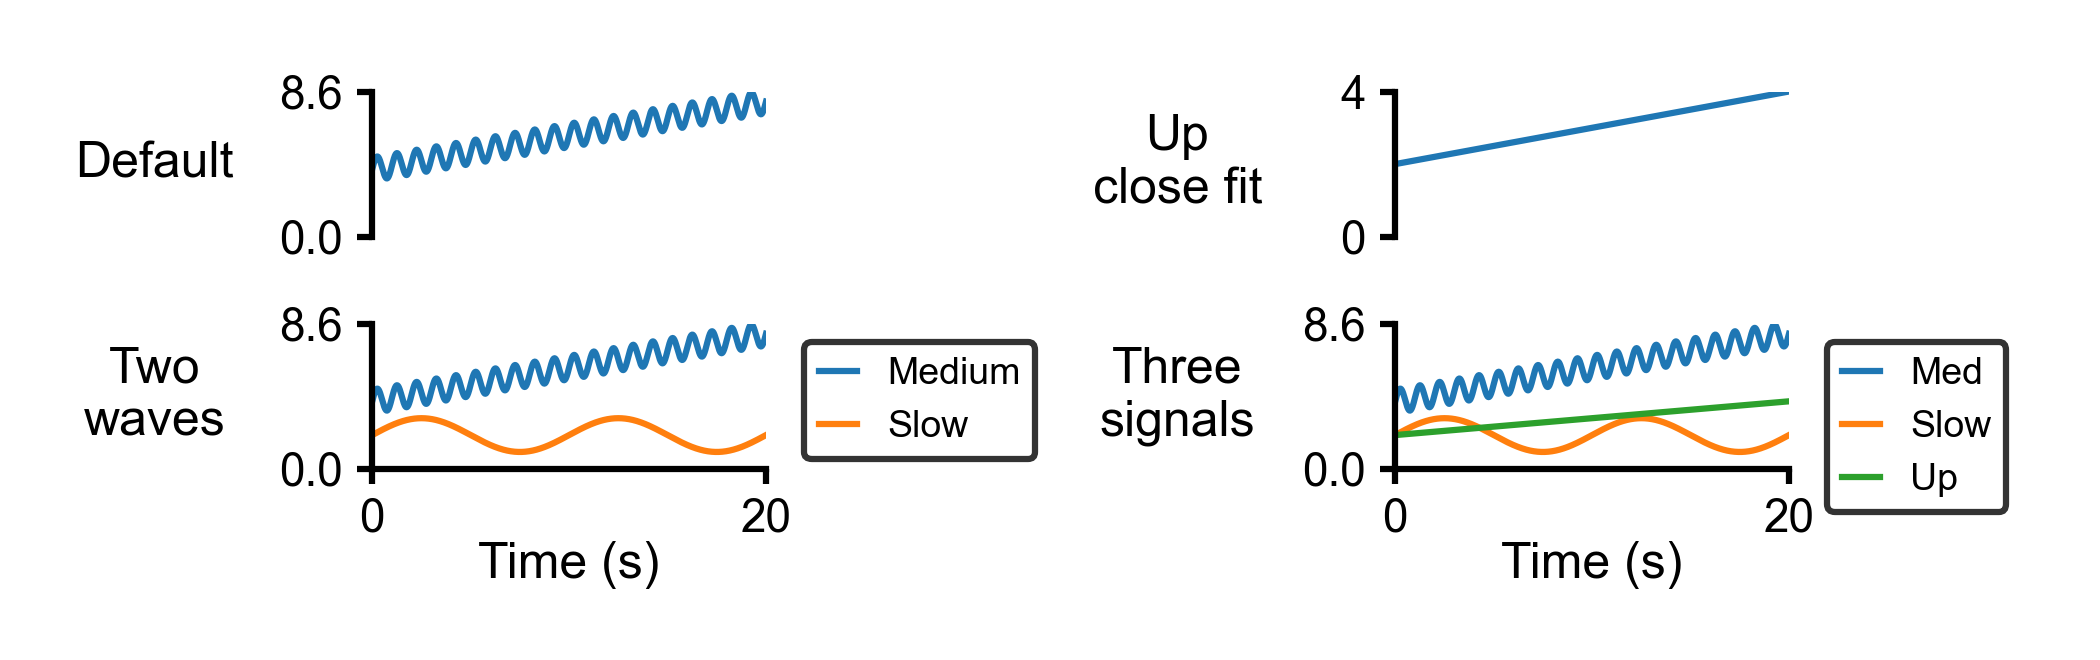
Example 14: 2 by 2 multipanel plots with multi series and labels.
>>> template_path = `templates/2X2_multi_series_labels.json`
>>> output_image_path = `<path_to>/2X2_multi_series_labels.png`
>>> mpl(data_file_string = data_path,
... template_file_string = template_path,
... output_image_file_string = output_image_path)
Example 15: Partial 2 by 2 multipanel plots with one panel showing envelope of responses.
>>> template_path = `templates/2X2_envelope_partial.json`
>>> output_image_path = `<path_to>/2X2_envelope_partial.png`
>>> mpl(data_file_string = data_path,
... template_file_string = template_path,
... output_image_file_string = output_image_path)
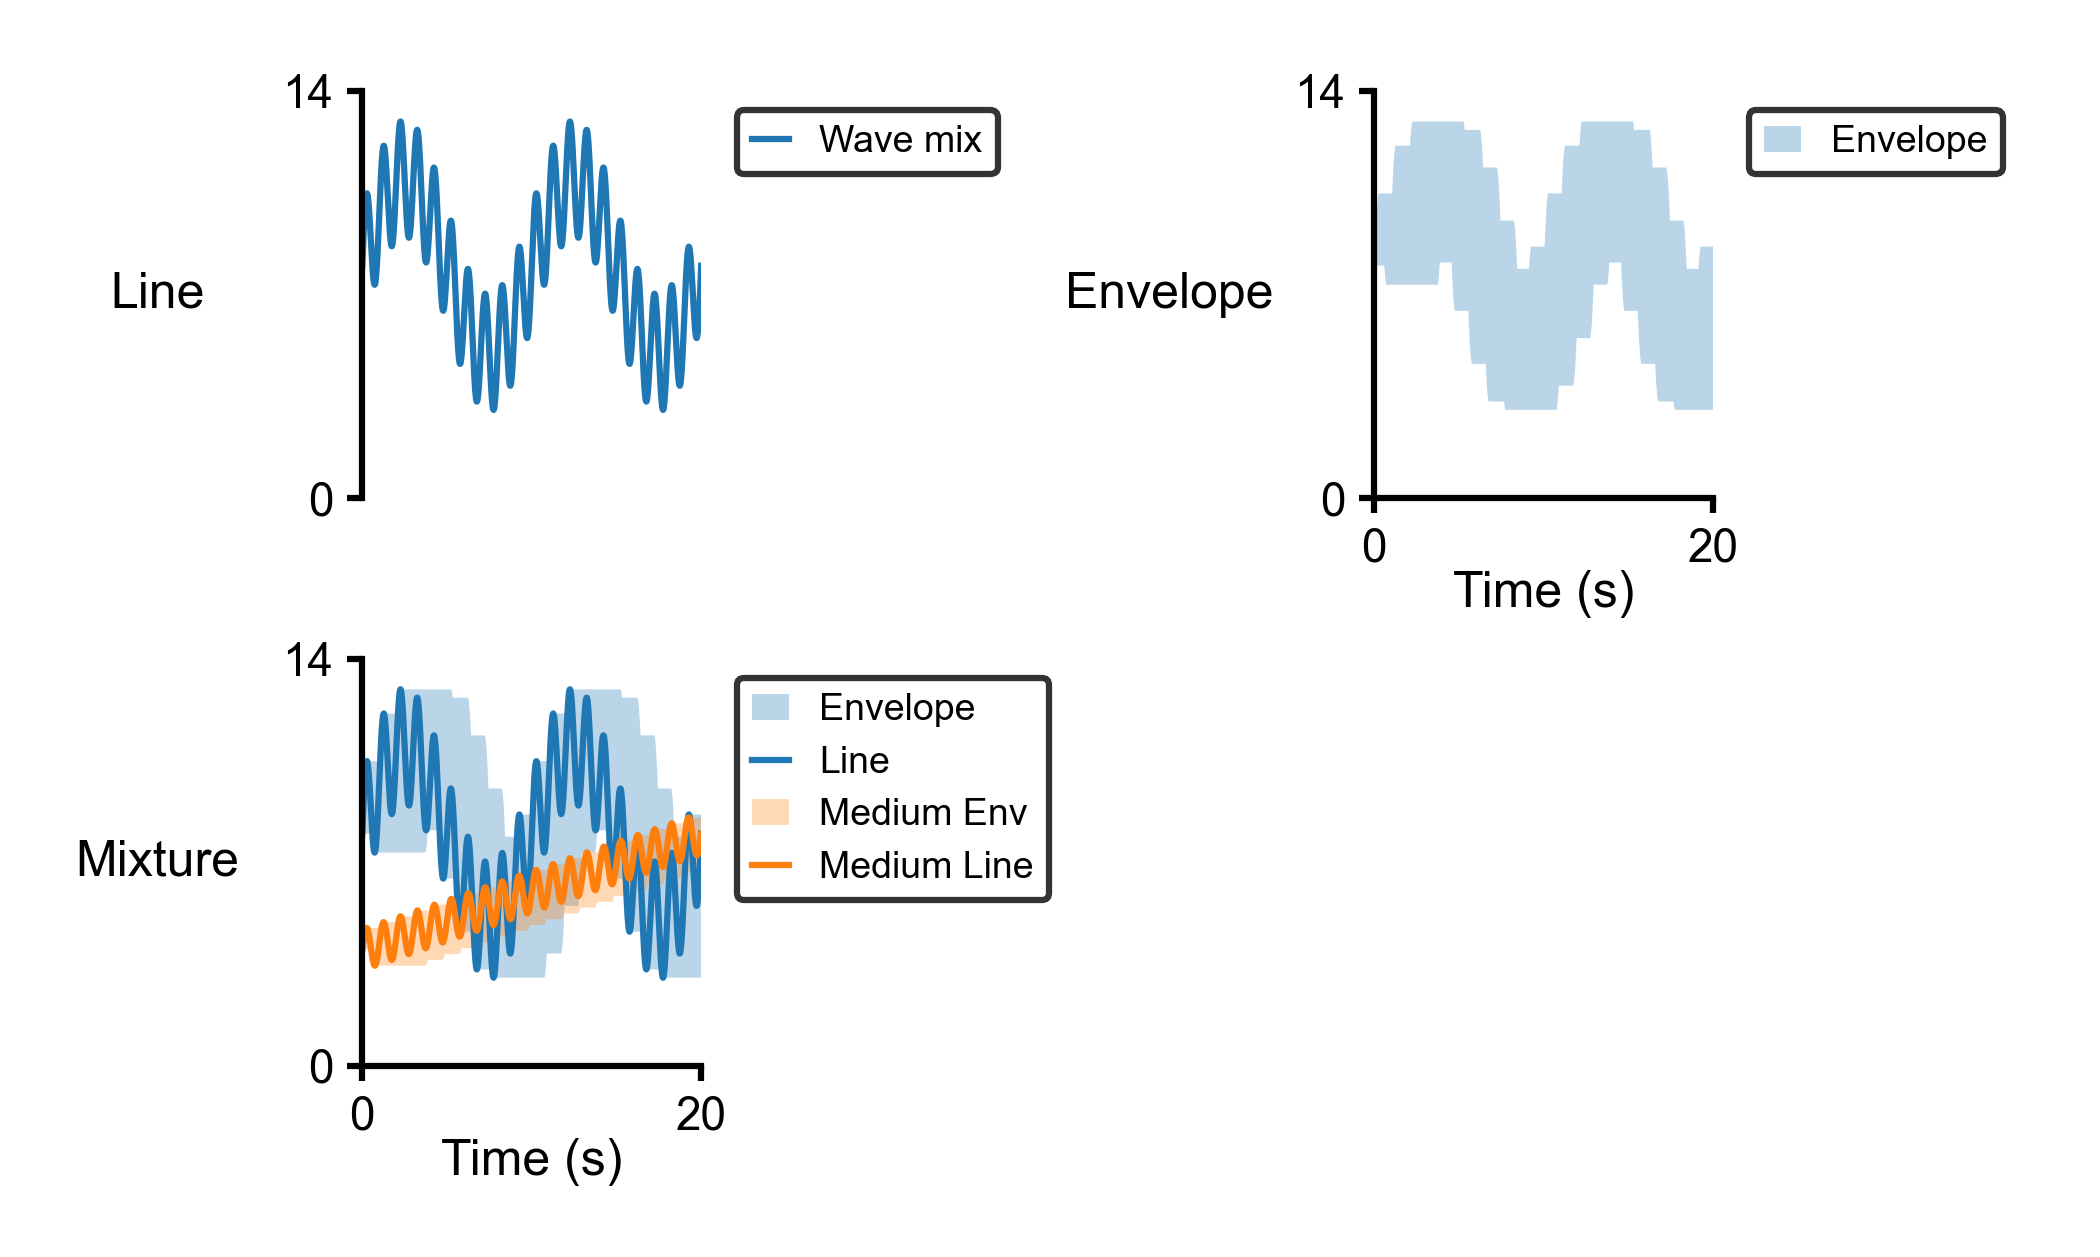
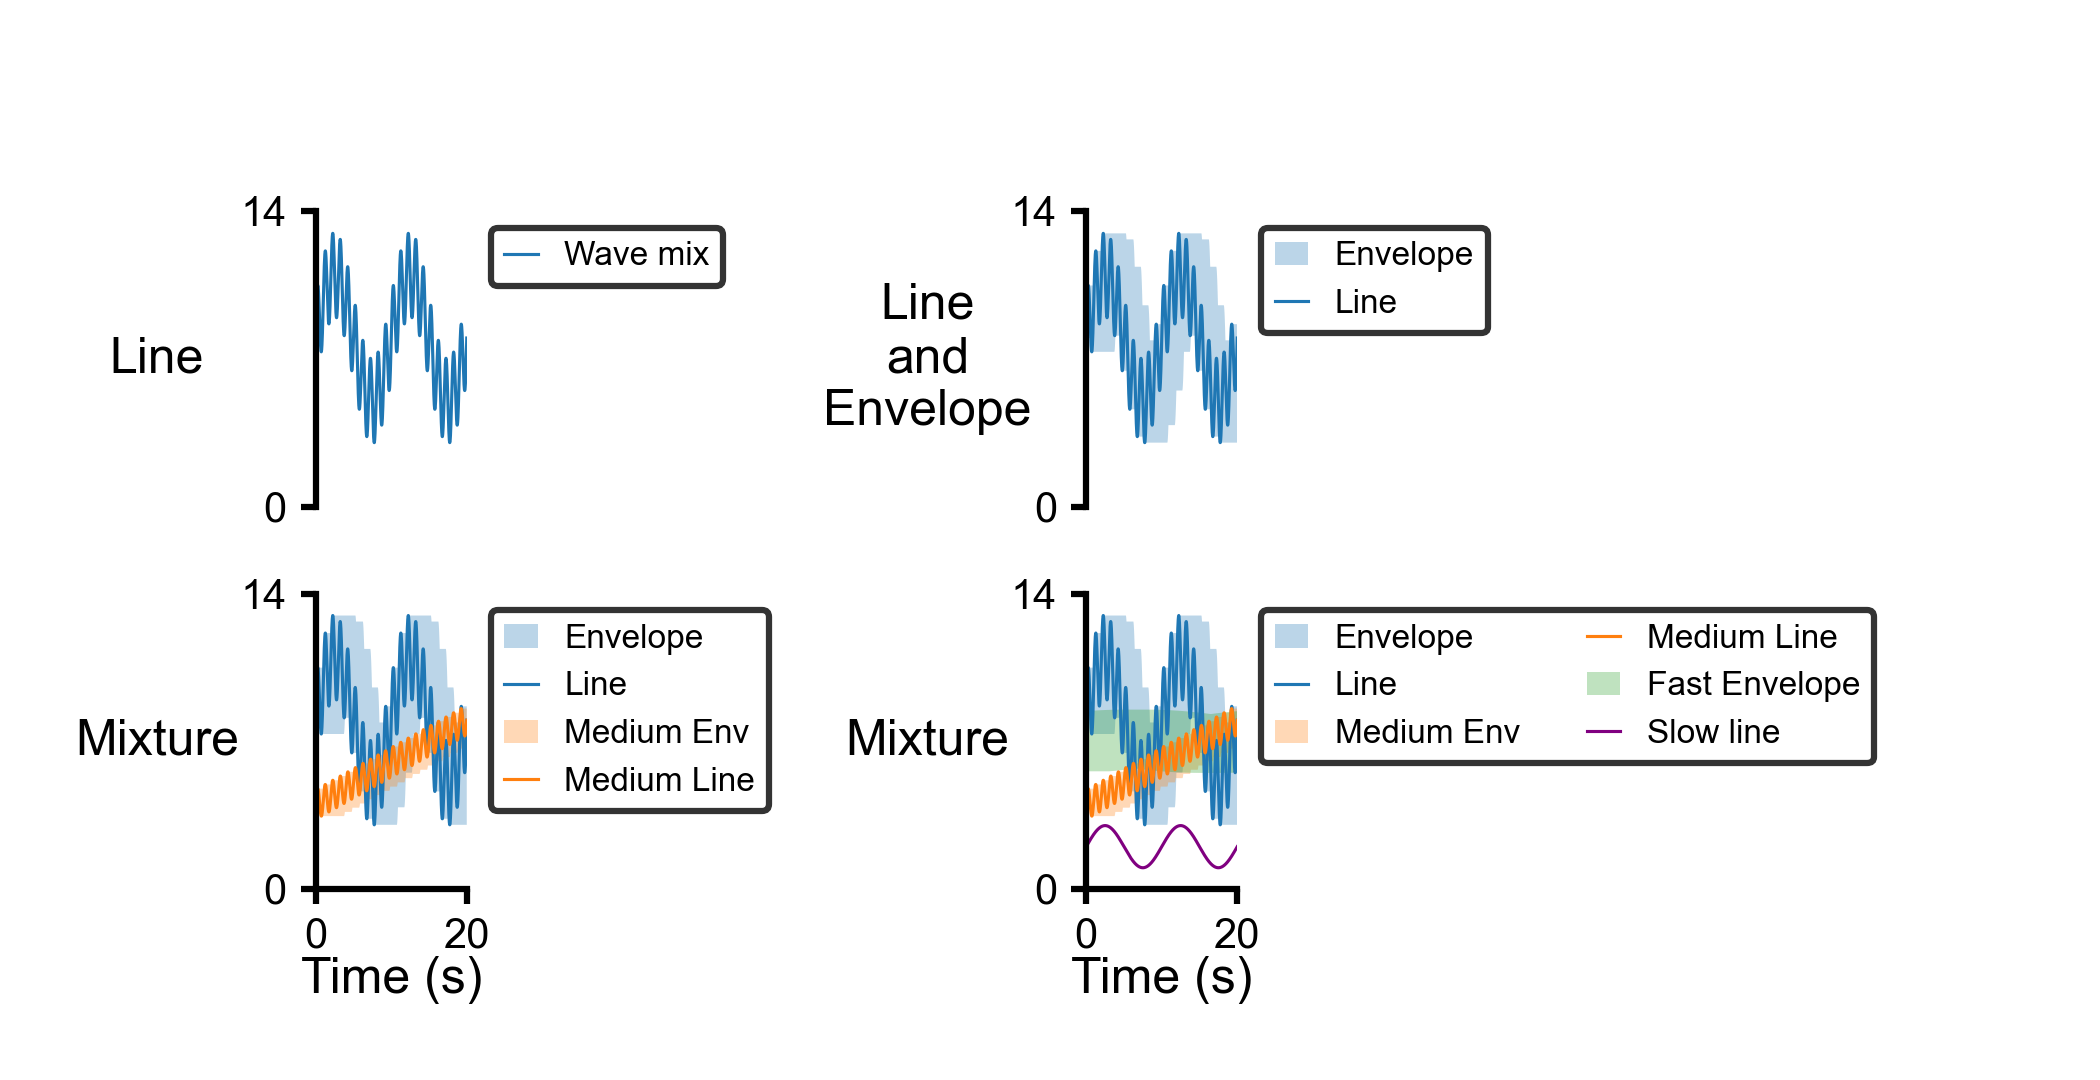
Example 16: 2 by 2 multipanel plots with mix of previous examples.
>>> template_path = `templates/2X2_mix.json`
>>> output_image_path = `<path_to>/2X2_mix.png`
>>> mpl(data_file_string = data_path,
... template_file_string = template_path,
... output_image_file_string = output_image_path)
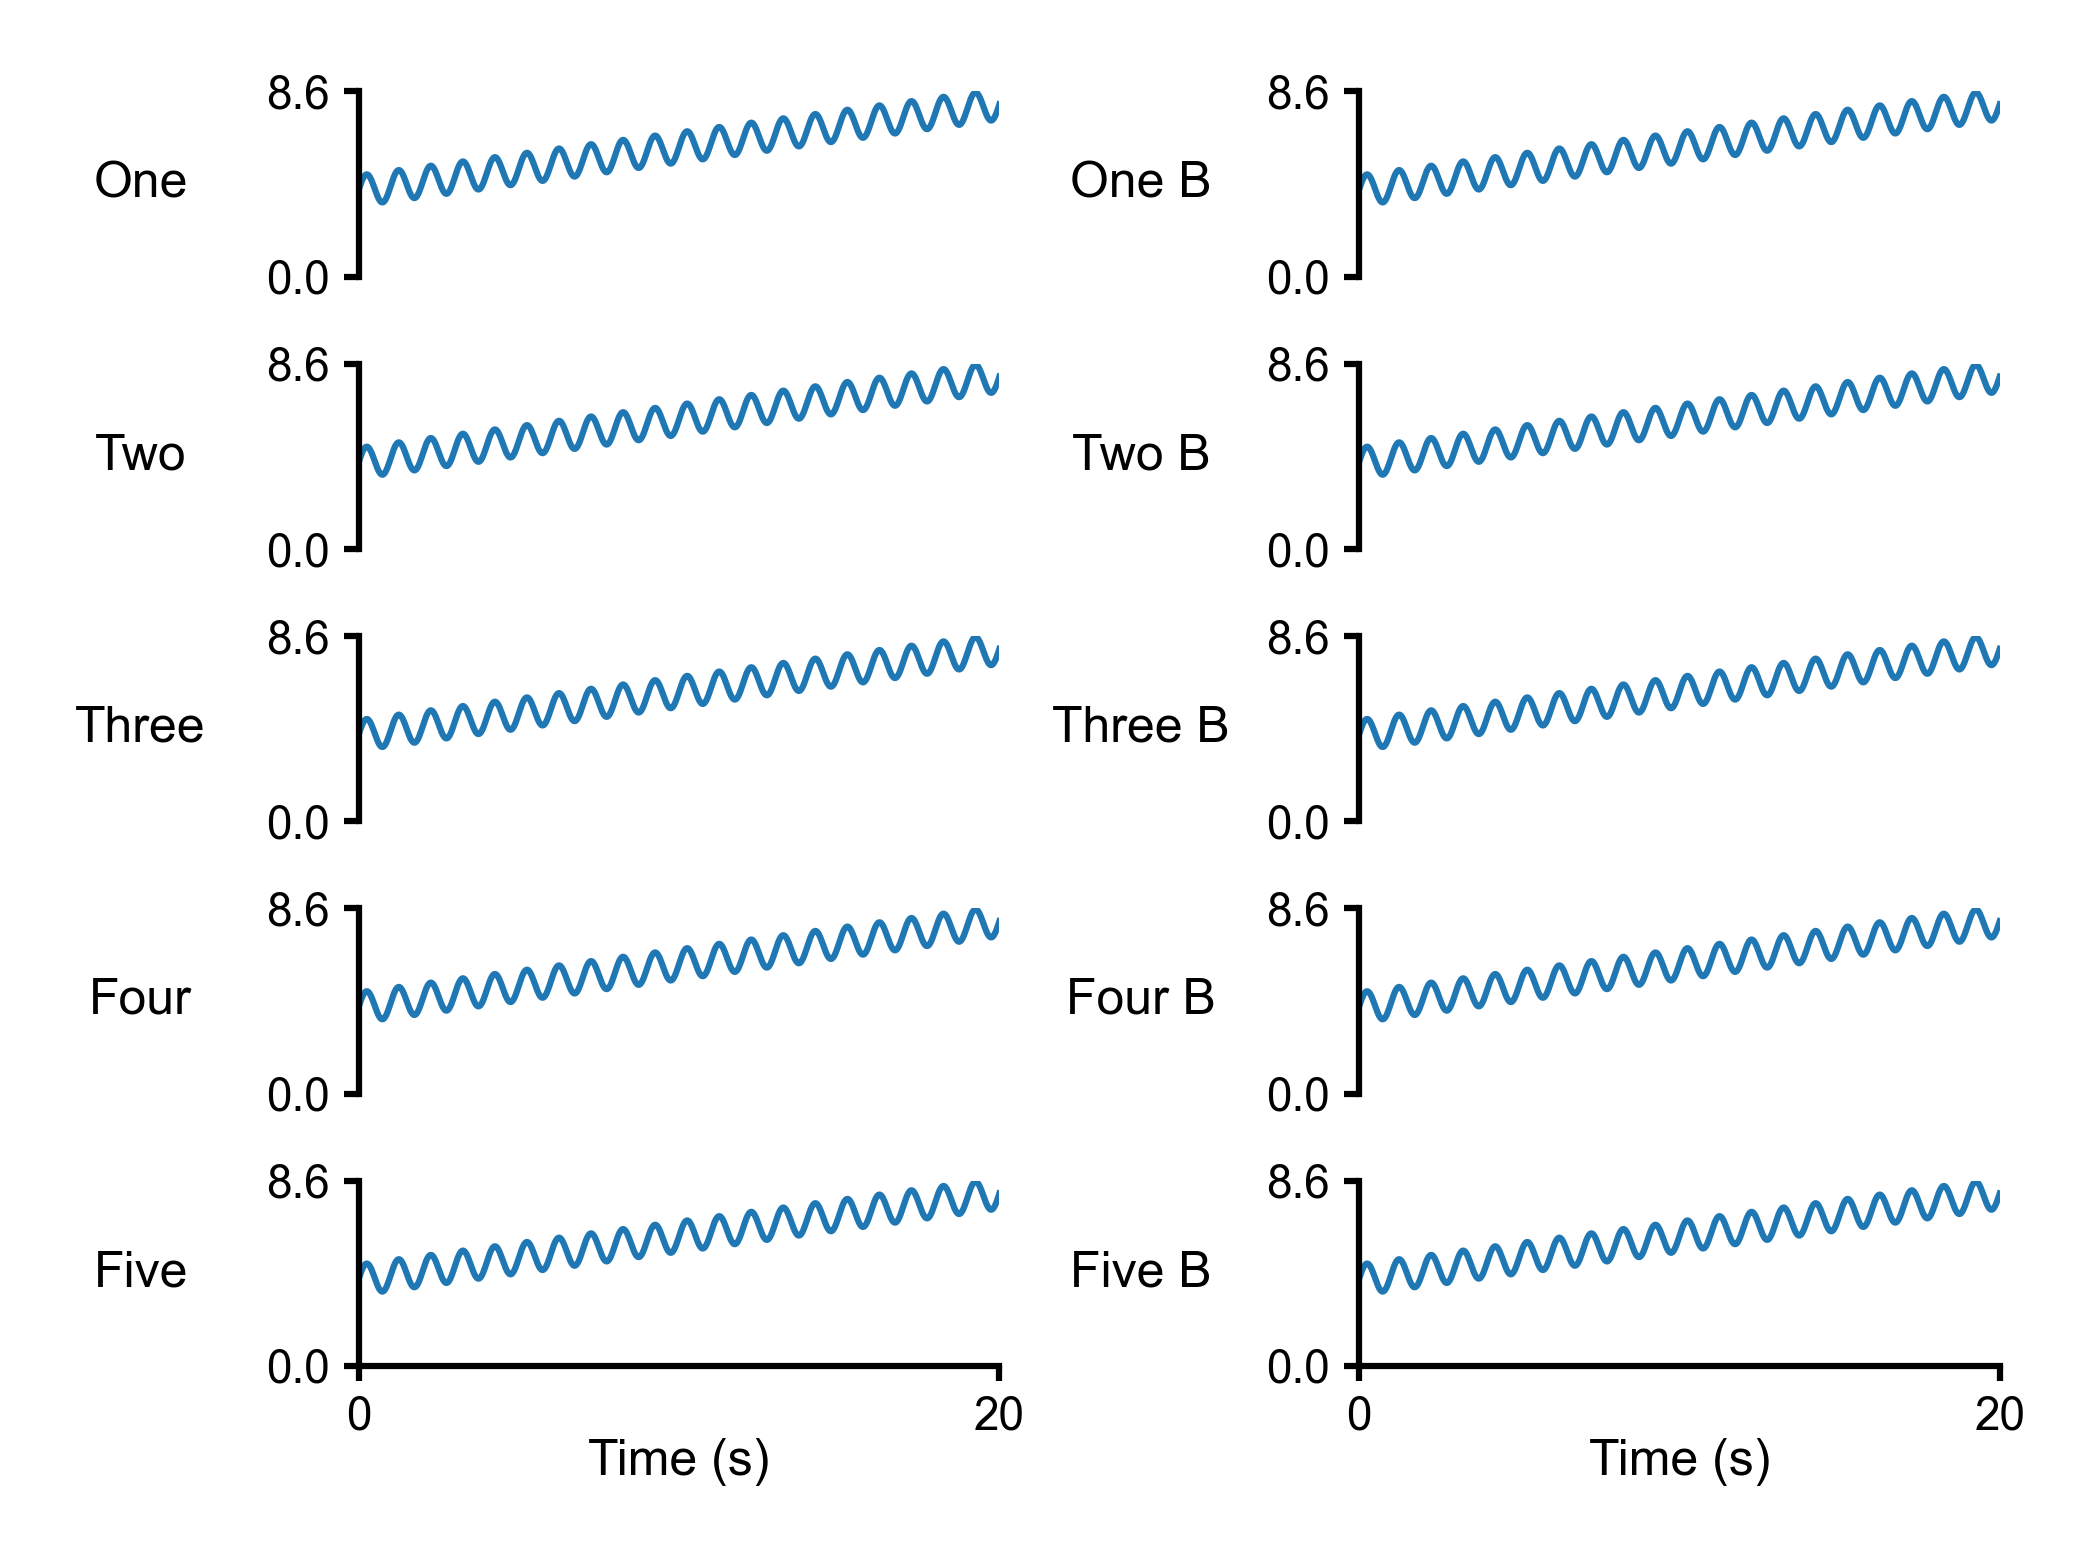
Example 17: 5 by 2 multipanel plots.
>>> template_path = `templates/5X2_mpl.json`
>>> output_image_path = `<path_to>/5X2_mpl.png`
>>> mpl(data_file_string = data_path,
... template_file_string = template_path,
... output_image_file_string = output_image_path)
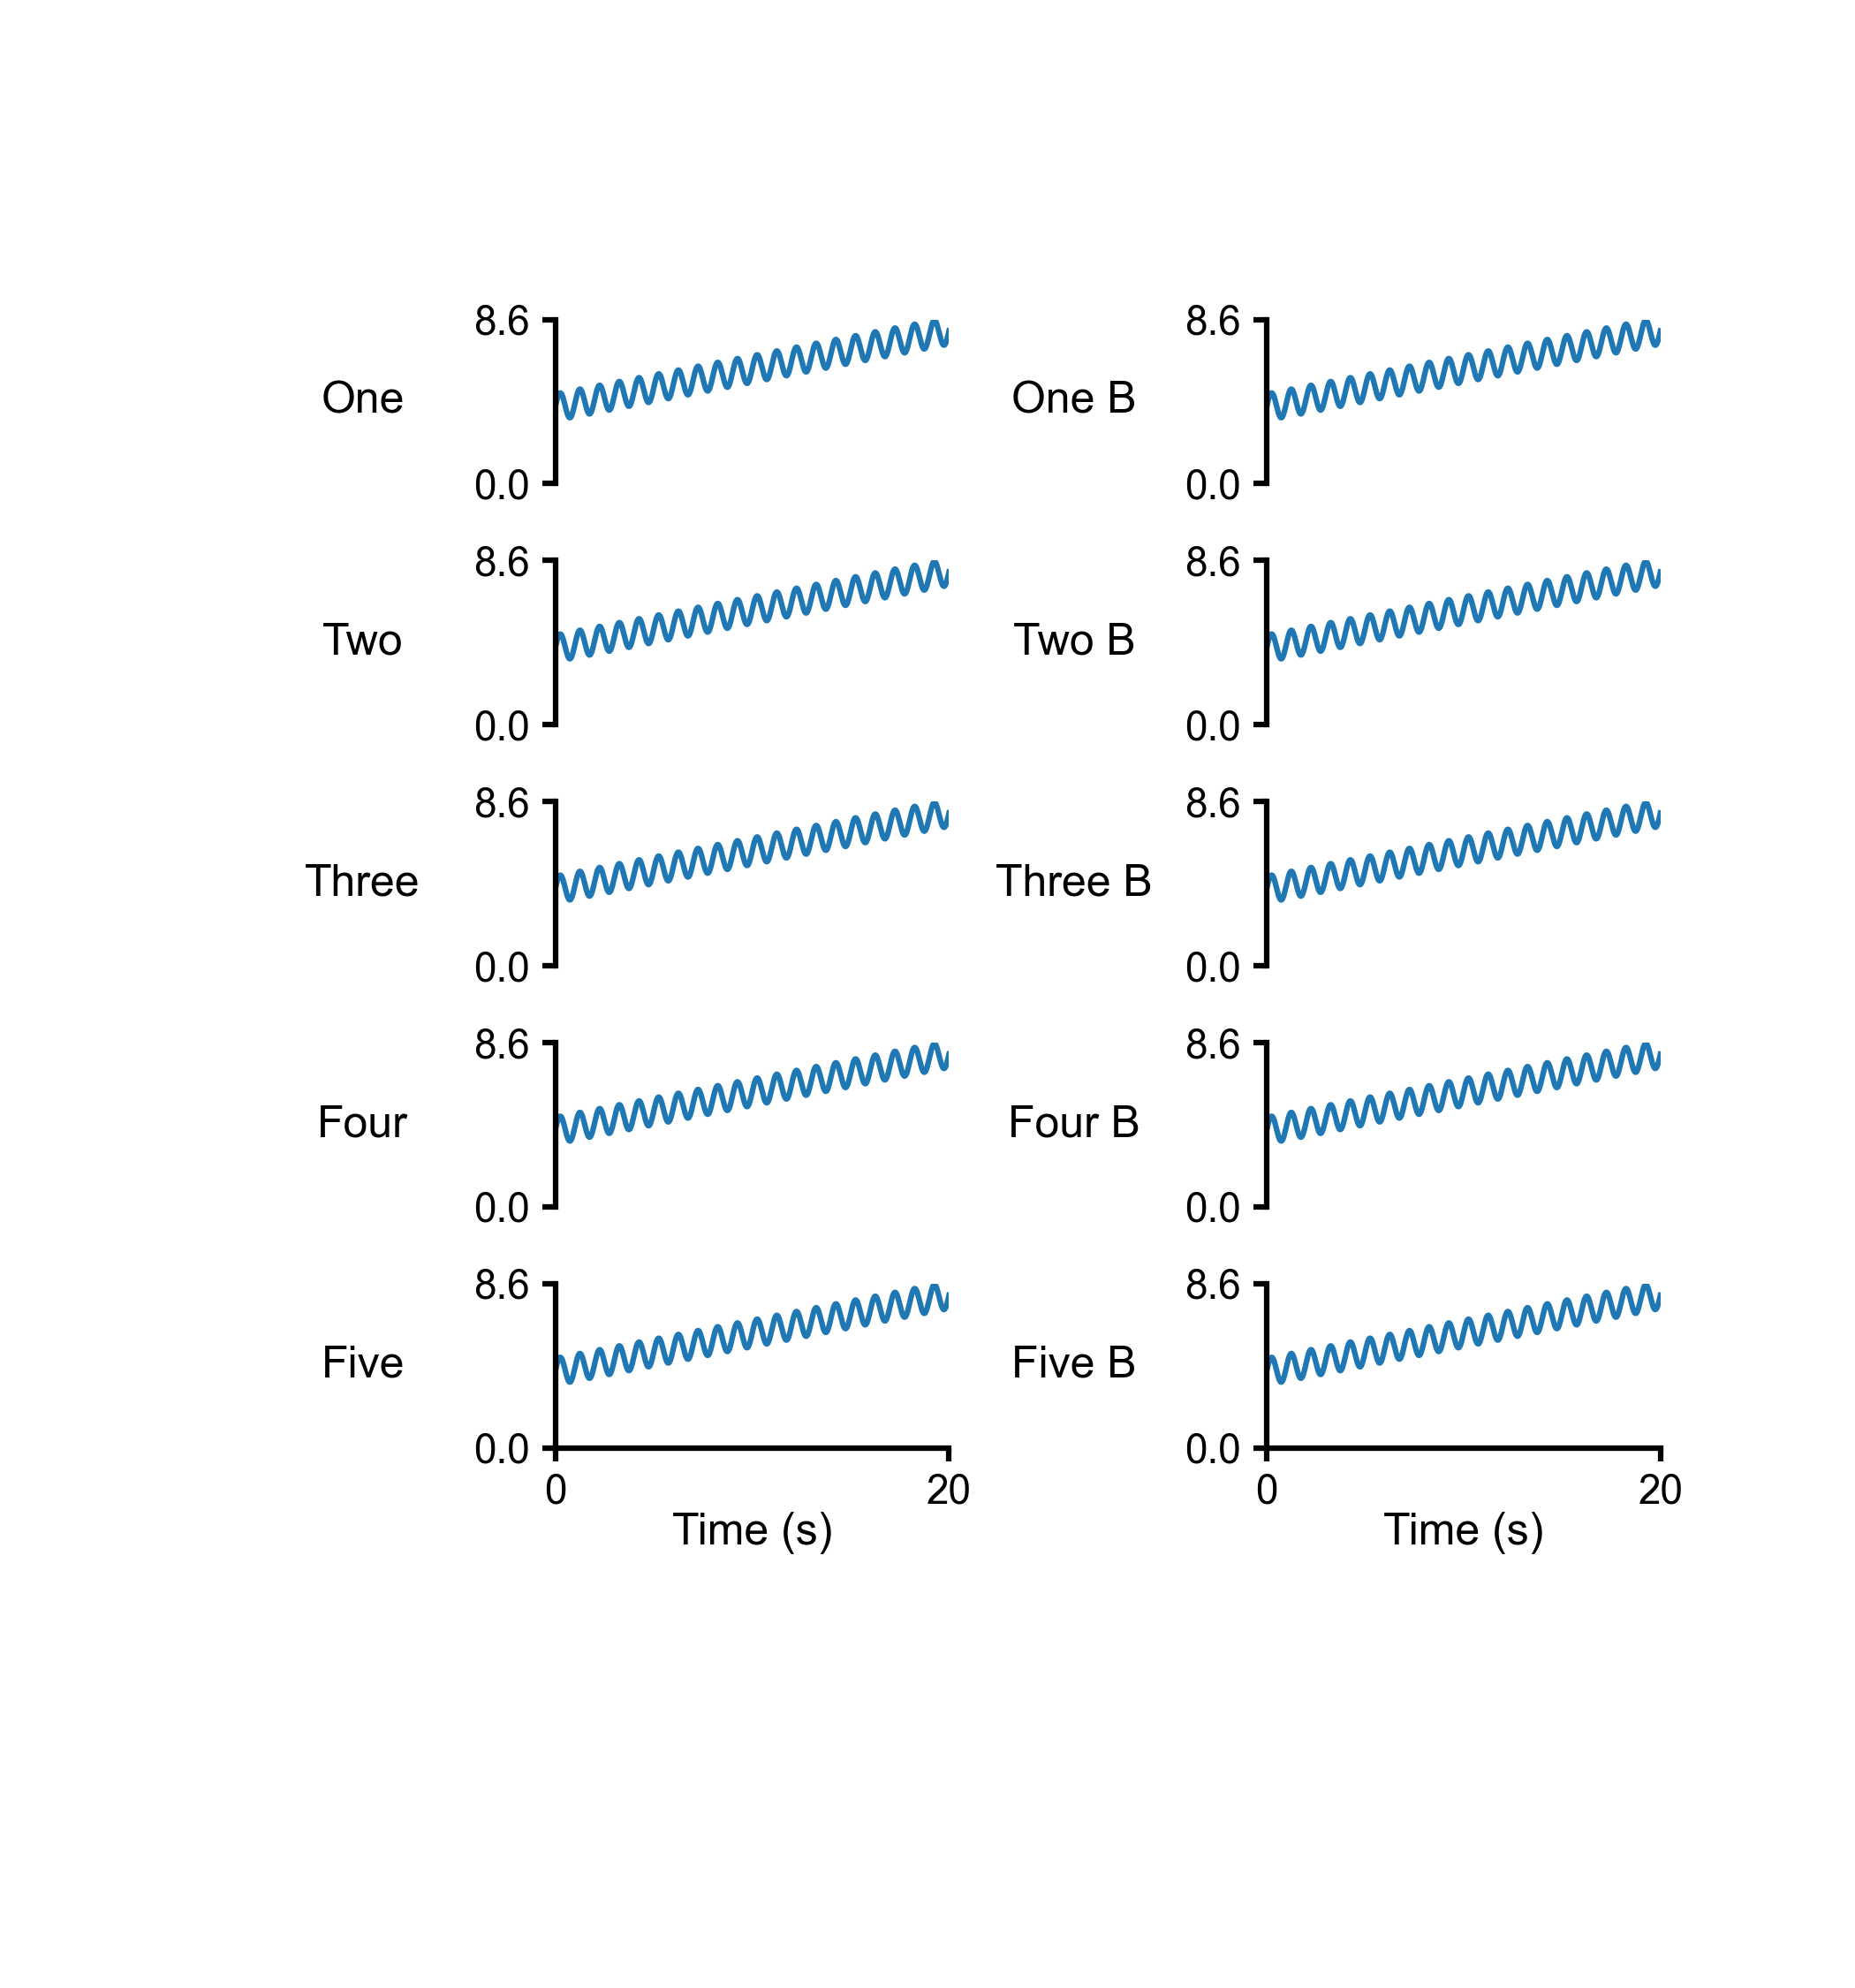
Example 18: 5 by 2 multipanel plots with margins.
>>> template_path = `templates/5X2_margins.json`
>>> output_image_path = `<path_to>/5X2_margins.png`
>>> mpl(data_file_string = data_path,
... template_file_string = template_path,
... output_image_file_string = output_image_path)
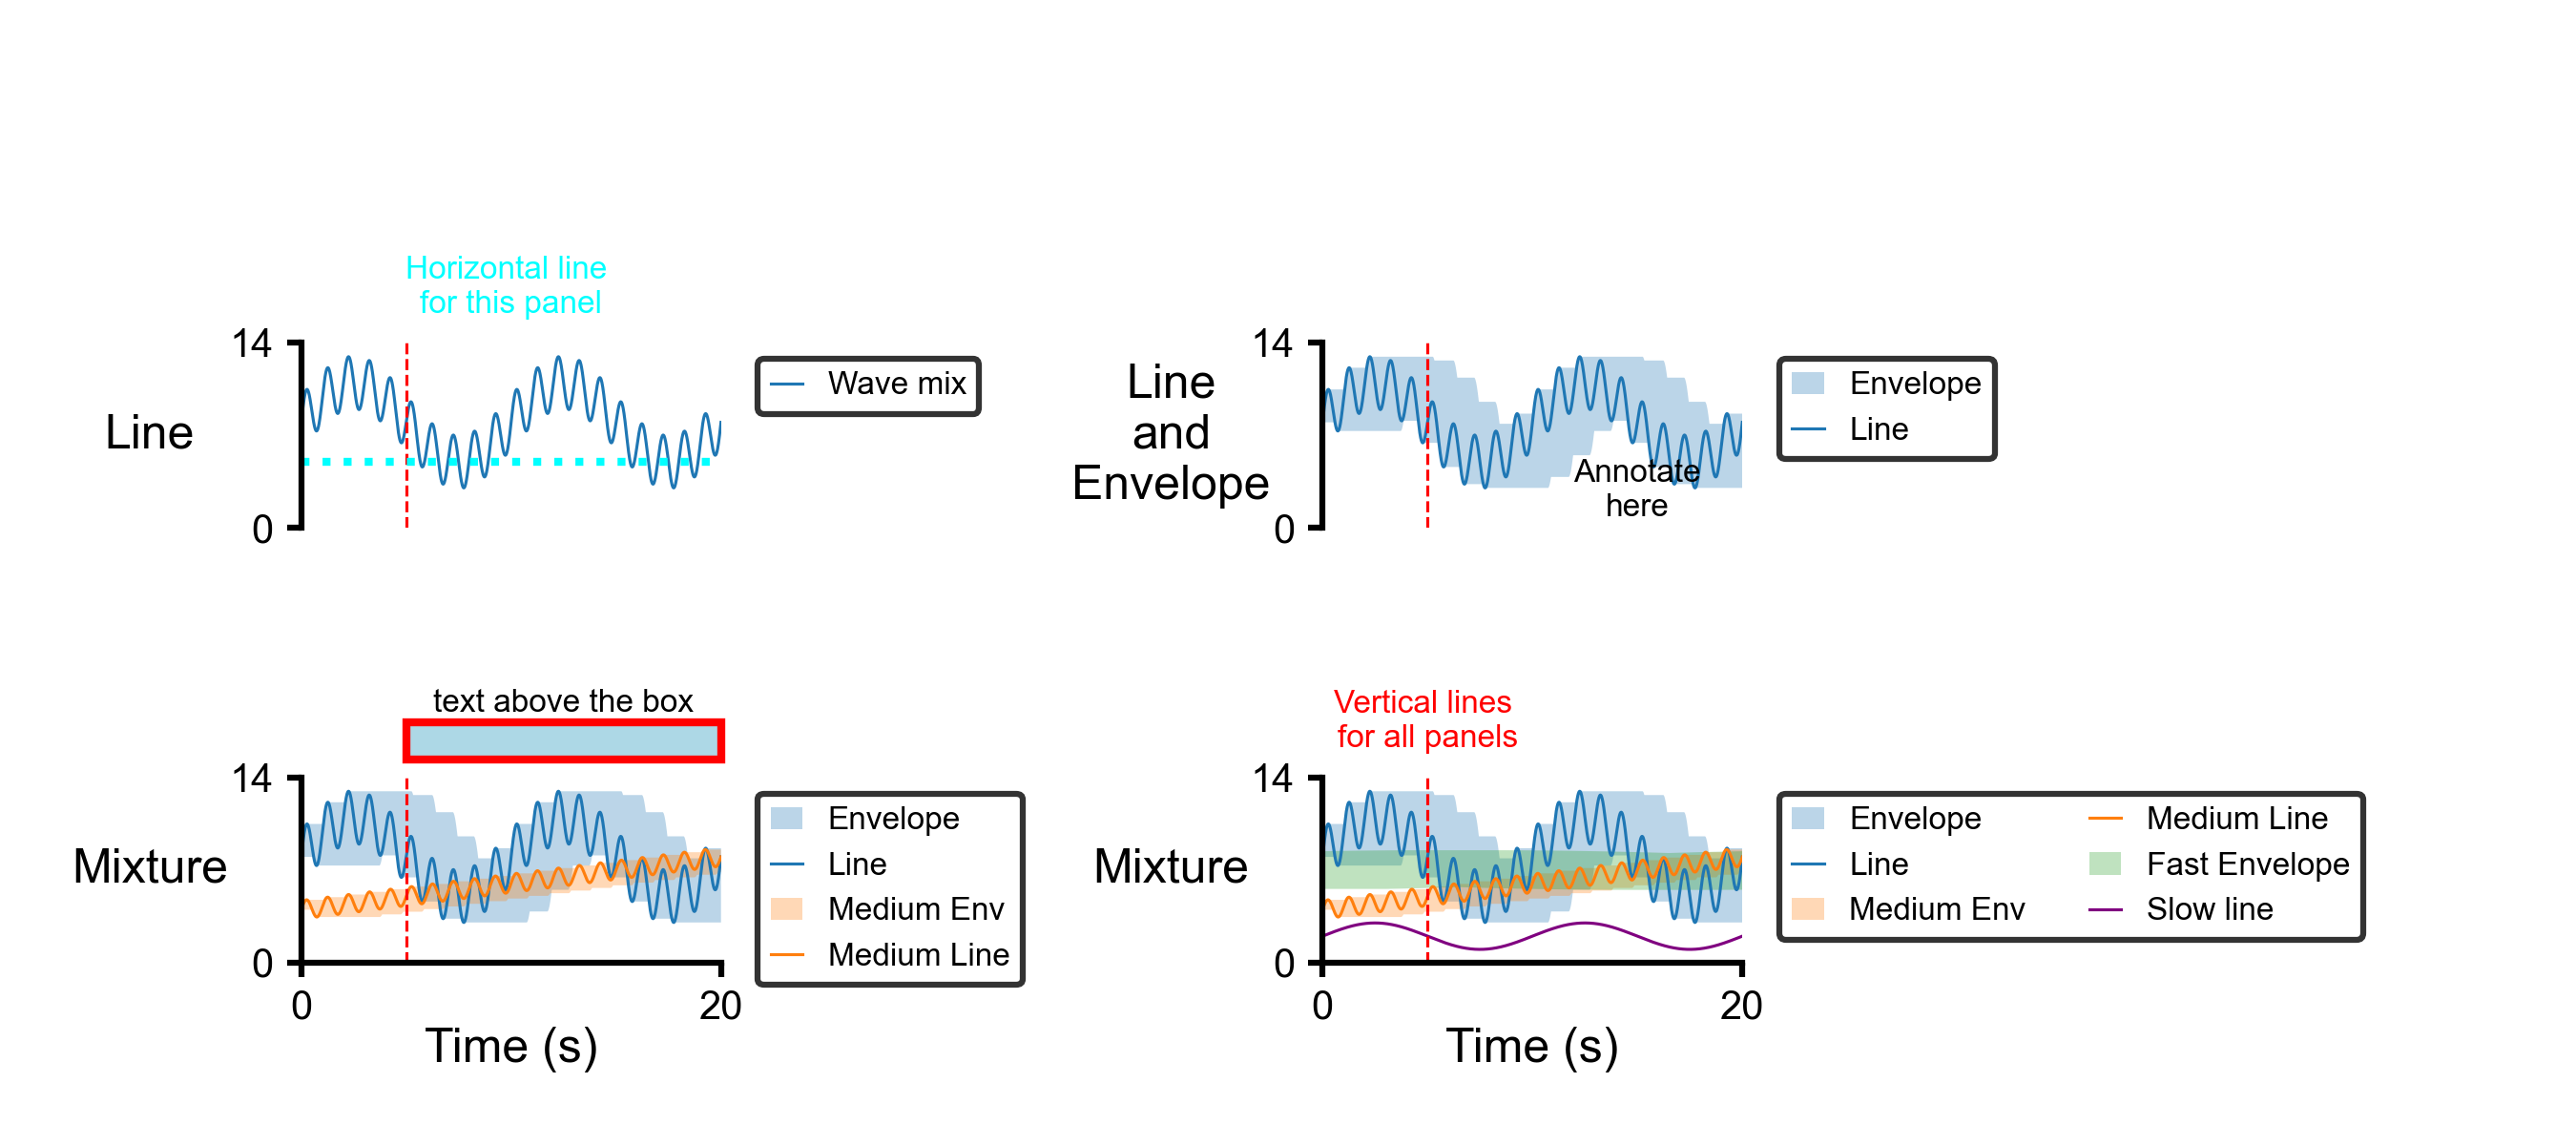
Example 19: Multipanel plots from Example 16 with multi annotations.
>>> template_path = `templates/2X2_mix_annotate.json`
>>> output_image_path = `<path_to>/2X2_mix_annotate.png`
>>> mpl(data_file_string = data_path,
... template_file_string = template_path,
... output_image_file_string = output_image_path)
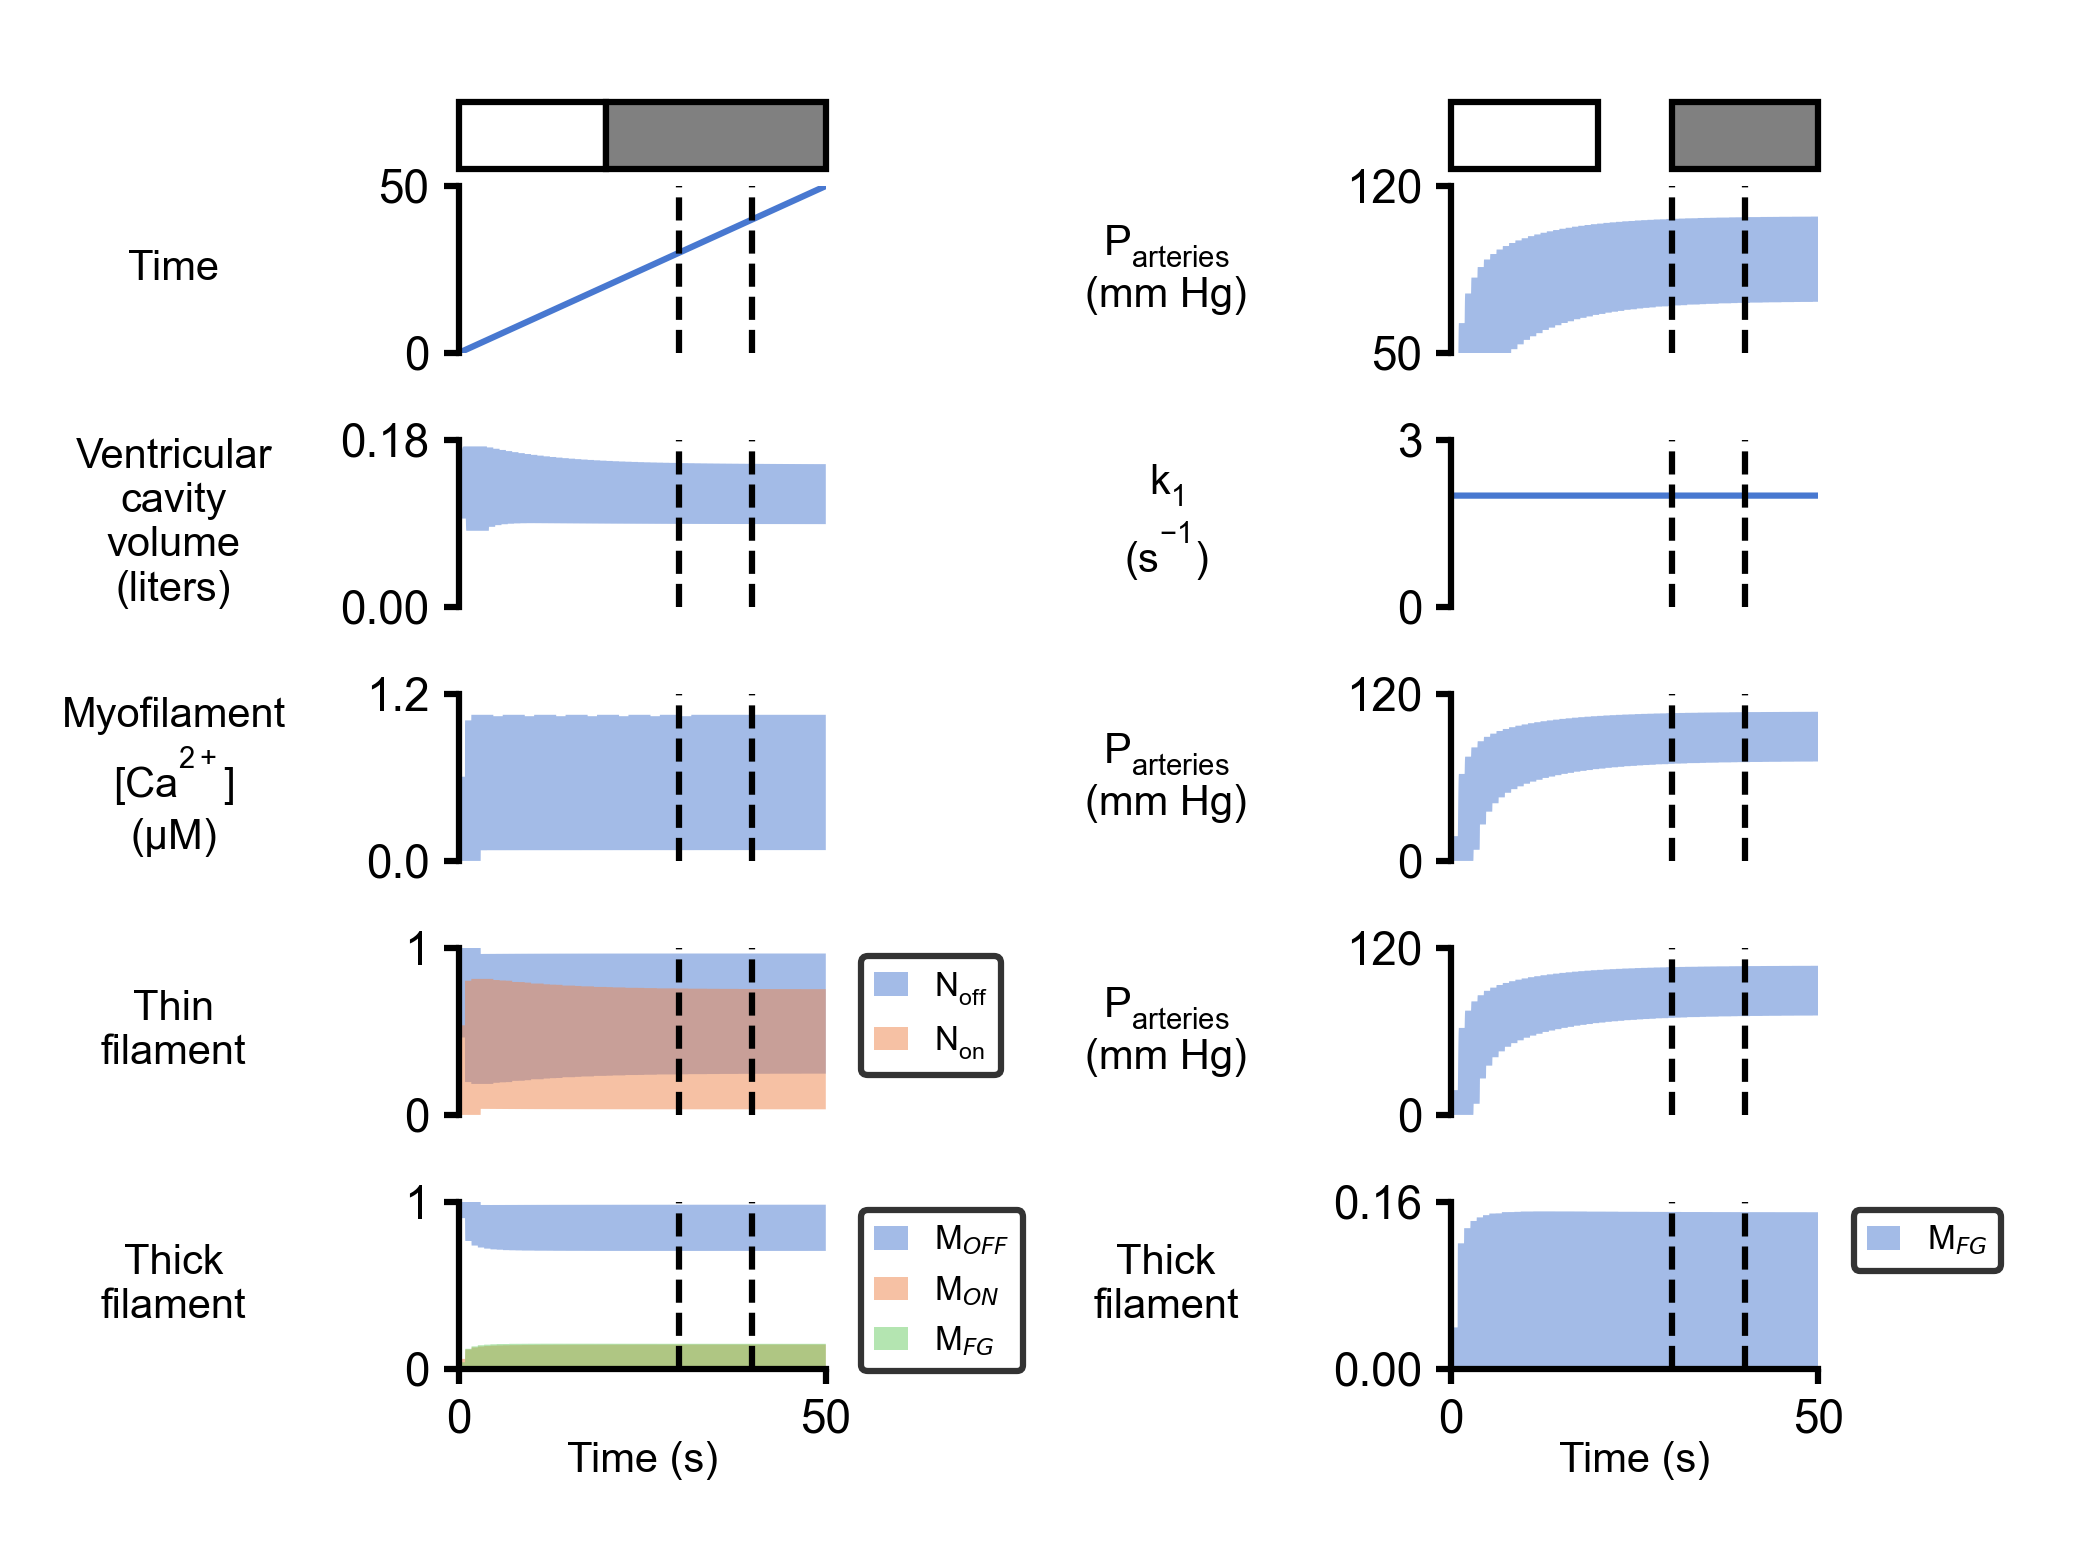
Example 20: A more complicated multipanel plots for a PyMyoVent simulation.
>>> data_path = `data/pymyovent_test.csv`
>>> template_path = `templates/pymyovent.json`
>>> output_image_path = `<path_to>/pymyovent.png`
>>> mpl(data_file_string = data_path,
... template_file_string = template_path,
... output_image_file_string = output_image_path)