Multipanel Numerical
Overview
This python tool helps to develop multipanel plots in a single figure when variables are numerical. 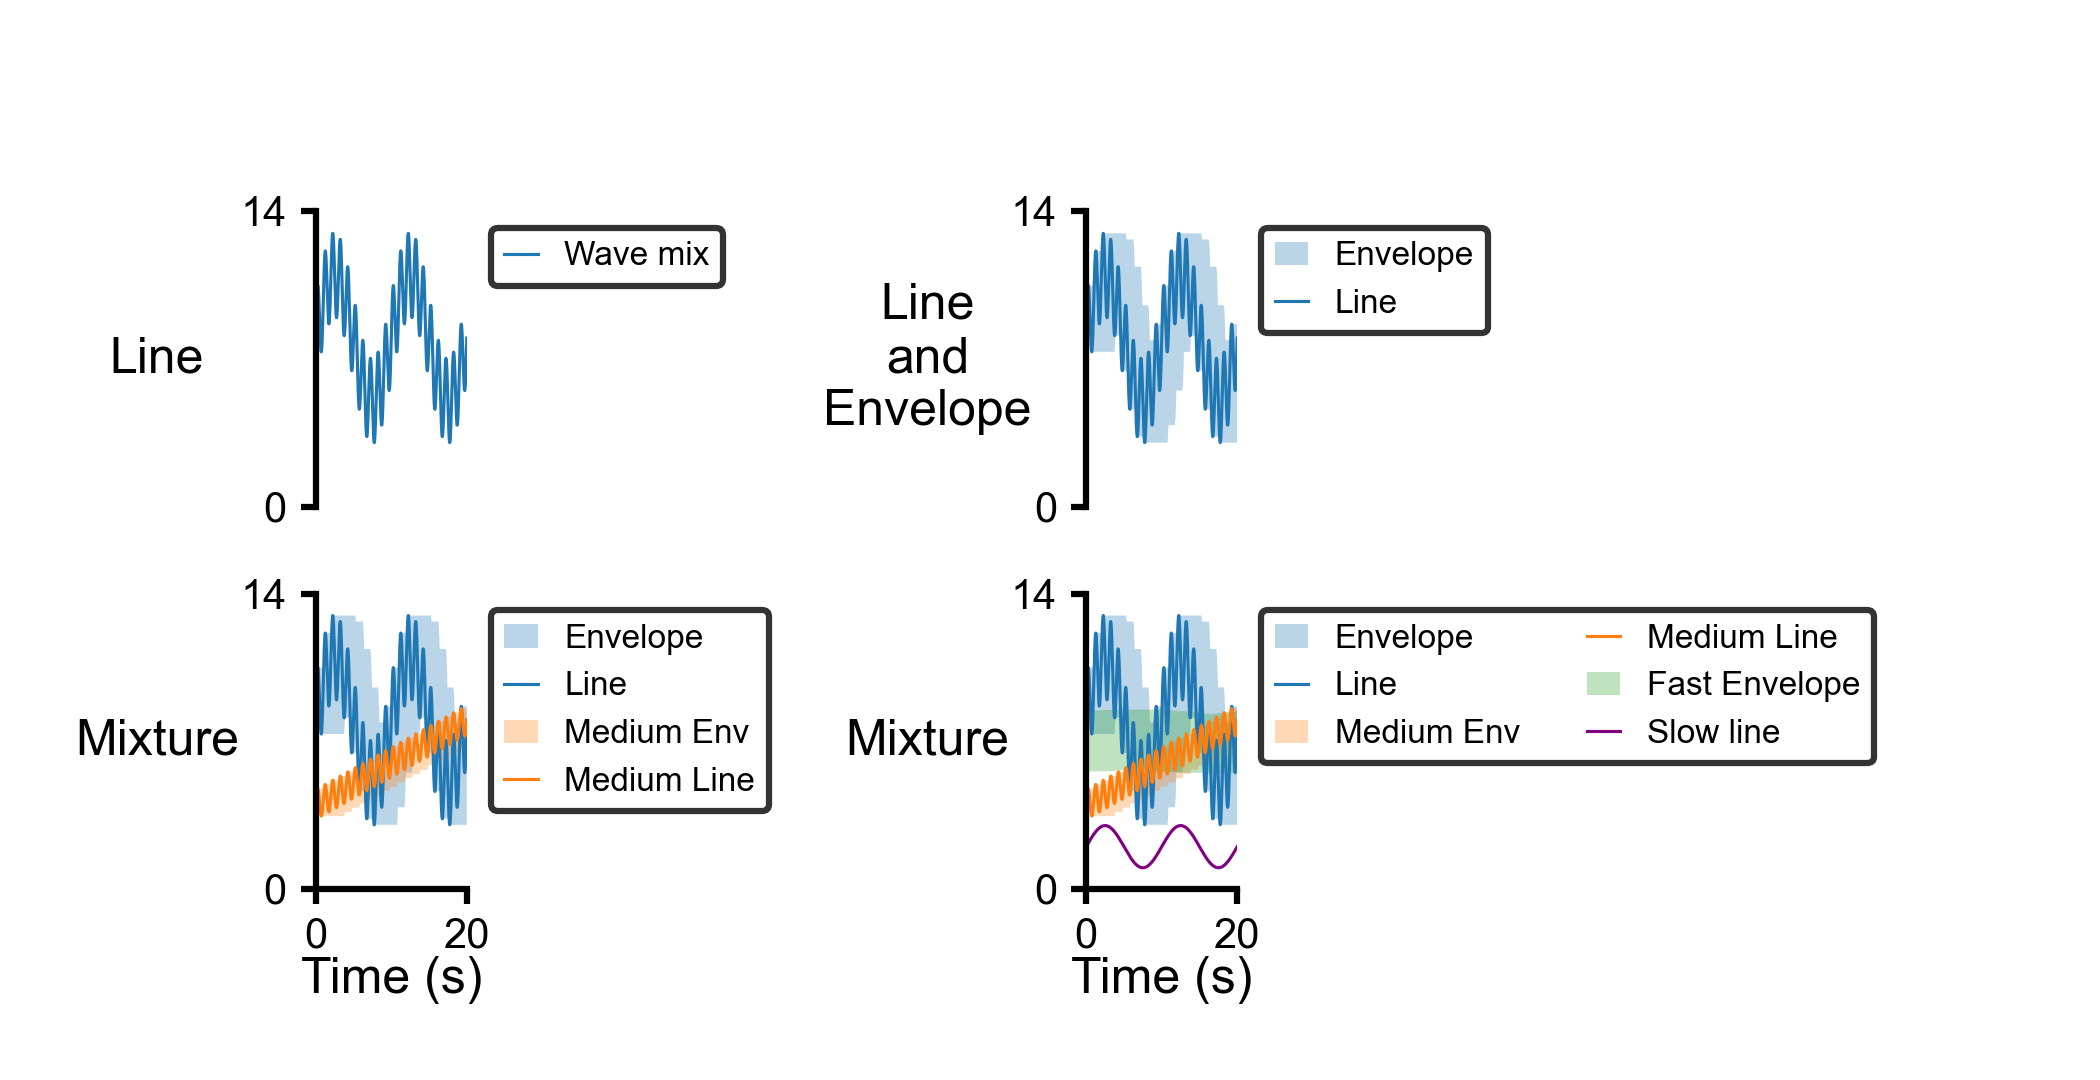
Function
Returns a tuple that contains a handle to the produced pyplot figure and a handle to an array of the pyplot axes.
PyCMLutil.plots.multi_panel.multi_panel_from_flat_data(
        data_file_string = [],
        excel_sheet = 'Sheet1',
        pandas_data = [],
        template_file_string=[],
        output_image_file_string = [],
        dpi = 300)
Parameters:
| Key | Type | Comment |
|---|---|---|
| data_file_string | str, optional | Path to the data file (either in format of csv or xlsx). The default is []. |
| excel_sheet | str, optional | Excel sheet where the data are stored. The default is Sheet1. |
| pandas_data | Pandas DataFrame, optional | DataFrame containing the data. The default is []. |
| template_file_string | str, optional | Path to the .json structure file. The default is []. |
| output_image_file_string | str, optional | Path where the output plot is saved. The default is []. |
| dpi | int, optional | Image resolution. The default is 300. |
Returns:
(figure, ax)
| Key | Comment |
|---|---|
| figure | Handle to the produced pyplot figure |
| ax | Handle to an array of the pyplot axes. |
Data spreadsheet
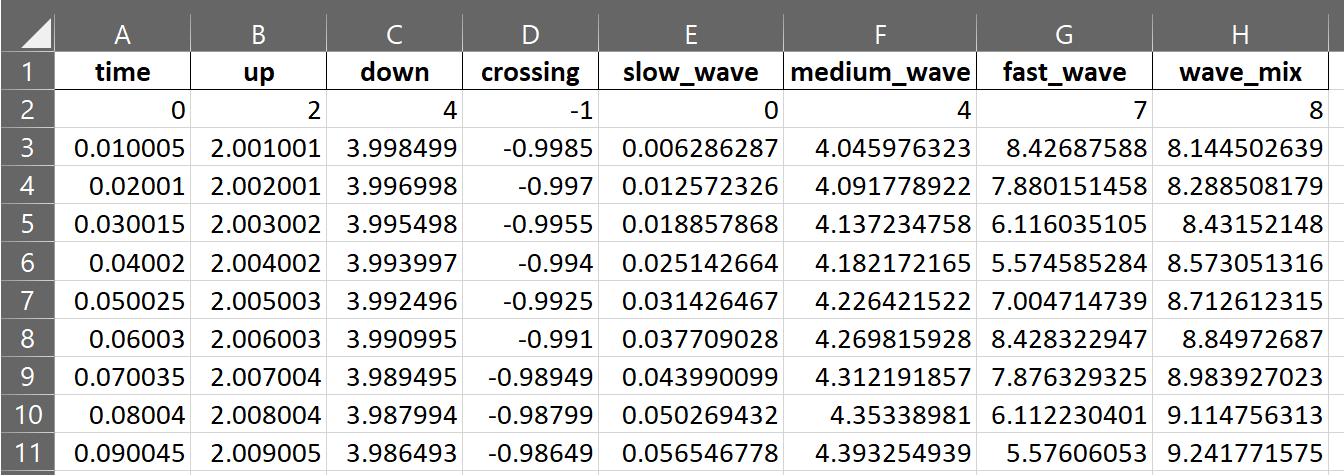
This function can reads data stored in an excel spreadsheet or Pandas DataFrame and generates the multipanel figure based on the template file.
Inputted data must be structured similar to a Pandas DataFrame. It should be a two-dimensional tabular data where each column represents a variable and each row represents a single observation for all variables.
Template file
Through the template file, the user can control the whole process of plotting a multipanel figure. The template file should be in JSONformat and can contain a set of data blocks to adjust the default parameters.
-
Section
panels: The most important section of the template file can be thepanelssection. This section is an array of dictionaries in which each dictionary holds the plotting information of each single subplot or panel in the multipanel figure. The general structure of this section is shown in below."panels": [ { "column": 1, "x_field": "x-axis variable", "x_ticks": ["tick_1", "tick_2"], "x_label": "x-axis label", "y_info": { "label": "Y Axis Label", "scaling_type": "close_fit" "series": [ { "field": "y_info_1", "field_label": "Series_1" "style": "line", "scaling_factor": "autoscaling", "log_display": false, "field_color": "black", } ] } } ]All possible parameters for defining of a single subplot/ panel are described below.
Parameters Type Comment column int Column index of the subplot. 1 represents the first column of subplots from the left hand side of the figure. x_field str, optional Name of the x-axis variable in data. If it is not defined, function uses the global_x_fieldinx_displaysectionx_ticks array, optional List of x-axis tick locations. y_info dict Dictionary of parameters that are related to y-axis. label str, optional Label for y-axis. scaling_type str, optional Mode of y-axis data scaling. Default value is autoscalingwhere it scales the y-axis data from zero-point and the most maximum of data (for negative values it would scale between zero and the minimum of dta).close_fitmode would scale data between the minimum and maximum of data.series array Series of y-axis information for each plot on a single subplot/panel. field str, optional Name of the y-axis variable in data. field_label str, optional Label for each plot. It will be used in the legend of the subplot. style str, optional Default is linewhere it uses matplotlib.pyplot.plot function. The other style isenvelopewhich plots the envelop of data using matplotlib.patches.Polygon function.scaling_factor float, optional Multiplier for the y-axis data. Default is 1. log_display boolean, optional Default is False. Computes logarithm of y-axis with base of 10 if it isTrue.field_color str, optional Color of plot. - Notes:
- To have multiple plots within a single subplot/panel you should define them within the
seriessub-section. - To have multiple subplots/panels within a figure, you should define them with multiple dictionaries within the
panelssection.
- To have multiple plots within a single subplot/panel you should define them within the
- Notes:
-
Section
formatting: Formatting section is optional. It controls the general formatting of the figure with the following structure. If it is not defined, default values will be used for plotting of the figure."formatting": { "data_linewidth": 1.5, "fontname" : 'Arial', "axis_linewidth": 1.5, "x_label_fontsize": 12, "x_label_pad": 0, "y_label_rotation": 0, "y_label_fontsize": 12, "y_label_pad": 30, "legend_location": "upper left", "legend_bbox_to_anchor": [1.05, 1], "legend_fontsize": 9, "legend_handlelength": 1, "tick_fontsize": 11, "patch_alpha": 0.3, "max_rows_per_legend": 4, "palette": None }Formatting parameters are described in below table.
Parameters Type Comment data_linewidth float, optional Line width of plots. Default is 1.50. fontname str, optional Font name for all texts in the figure. Default is Arial.axis_linewidth float, optional Linewidth of axes. Default is 1.50. x_label_fontsize float, optional Font size of x-axis label. Default is 12. x_label_pad scalar, optional Spacing in points from the x-axis bounding box including ticks and tick labels. y_label_rotation float, optional Angle in which the y-axis label is shown. Default is 0. y_label_fontsize float, optional Font size of y-axis label. Default is 12. y_label_pad scalar, optional Spacing in points from the y-axis bounding box including ticks and tick labels. legend_location str, optional The location of the legend. Default is "upper left". Other options can be found on matplotlib.pyplot.legend.legend_bbox_to_anchor str, optional Box that is used to position the legend in conjunction with legend_location. This argument allows arbitrary placement of the legend. Default is [1.05, 1]. For more details visit matplotlib.pyplot.legend.legend_fontsize float, optional Font siz of legend. Default is 9. legend_handlelength float, optional The length of the legend handles, in font-size units. Default is 1. tick_fontsize float, optional Font siz of ticks. Default is 11. patch_alpha float, optional The alpha transparency of patches. Default is 0.3. max_rows_per_legend int, optional Maximum number of rows in the legend box. Default is 4 palette str, optional Name of the colormap in matplotlib. -
Section
layout: Similar toformatting, it is an optional section. It controls the layout of the figure. If it is not defined in the template file, default values will be used."layout": { "fig_width": 3.5, "panel_height" : 1, "top_margin": 0.1, "bottom_margin": 0.1, "left_margin": 0.1, "right_margin": 0.1, "grid_wspace": 0.1, "grid_hspace": 0.1 }Layout parameters are defined in below table.
Parameters Type Comment fig_width float, optional Width of the figure. panel_height float, optional Height of each subplot/ panel in the figure. top_margin float, optional Layout magrgin at the top of the figure. bottom_margin float, optional Layout magrgin at the bottom of the figure. left_margin float, optional Layout magrgin at the left side of the figure. right_margin float, optional Layout magrgin at the right side of the figure. grid_wspace float, optional The amount of width reserved for space between subplots. grid_hspace float, optional The amount of height reserved for space between subplots. -
Section
x_display: This section can be used to globally define the x-axis for all subplots/ panels."x_display": { "global_x_field": "", "global_x_ticks": ["tick_1", "tick_2"],, "label": "Time (s)" }Parameters Type Comment global_x_field str, optional Name of the global x-axis variable in data. global_x_ticks float, optional List of x-axis tick locations. label str, optional Global label for x-axis. -
Section
annotations: Using this section allows to annotate any subplot/ panel in a multipanel figure. Right now, four types of annotations (h_line,v_line,text, andbox) are supported. In the following json structure, examples are brough for each type of annotations.As many as annotation is required can be added in this section.
 "annotations":
 [
     {
         "panel": 0,
         "type": "h_line",
         "y_value": 5,
         "linestyle": ":",
         "linewidth": 2,
         "color": "cyan"
     },
     {
         "panel": 0,
         "type": "v_line",
         "x_value": 5,
         "linestyle": ":",
         "linewidth": 2,
         "color": "cyan"
     },
     {
         "panel": 0,
         "type": "text",
         "x_coord": 10,
         "y_rel_coord": 1.3,
         "label": "Horizontal line \nfor this panel",
         "label_fontsize": 8,
         "label_color": "cyan"
     },
     {
         "panel": 2,
         "type": "box",
         "x_coord": 5,
         "width":15,
         "y_rel_coord": 1.1,
         "rel_height": 0.2,
         "linestyle": "-",
         "linewidth": 2,
         "face_color":"lightblue",
         "edge_color": "red"
     }
 ]
Parameters Type Comment panel int or str Panel/ subplot index, starting from 0, in which will be annotated. It is based on the order of panel data that are contained in panelssection. For example,"panel": 2means the third panel inpanelssection will be annotated. To assign an annotations to all subplots/ panels, alternatively, a keyword of"all"can be used.type str Type of annotation. It can be any of the following list: "h_line": To annotate a horizontal line."v_line": To annotate a vertical line."text": To annotate a text."h_line": To annotate a box.y_value float The y-axis value in which the horizontal line would be added. It is only required for h_linetype of annotation.linestyle str, optional Line style for h_line,v_line, and frameboxtypes of annotations. It can be changed according to matplotlib. Default is"--"or"dashed".linewidth float, optional Line width for h_line,v_line, and frameboxtypes of annotations. Default value is equalt todata_linewidthin theformattingsection.color str, optional Line color for h_lineorv_linetypes of annotation.x_value float The x-axis value in which the vertical line would be added. It is only required for v_linetype of annotation.x_coord float The x-axis coordination, in which the textor bottom-left corner ofboxannotations woul be placed on a subplot/ panel.y_rel_coord scalar The relative y-axis coordination, in which the textor bottom-left corner ofboxannotations woul be placed on a subplot/ panel. For example,"y_rel_coord": 1implies one times of amplitude above the reference y-axis point. Or"y_rel_coord": -2implies two times of mplitude below the reference y-axis point.label str Text label for textannotation.label_fontsize float, optional Font size of textannotation.label_color str, optional Color of textannotation.width float Width of the boxannotation starting from thex_coord.rel_height bool, optional Height of boxannotation relative to the amplitude of y-axis starting from they_rel_coord.face_color str, optional Face color of the boxannotation. Default isNone.edge_color str, optional Color of boxannotation frame. Default is"black".
Now try demos