Two-way model in MATLAB
Update your local copies of
Make sure you have read and understand the accompanying SAS page
Implementation
MATLAB needs a place to store the SAS code and the SAS output file. You neeed the following sub-folders
- sas_code
- sas_results in your working directory. These should be created as part of the repo.
Then run two_way_linear_mixed_model.m
function two_way_linear_mixed_model
% Code runs a one-way linear mixed model

data_file_string = 'data\two_way_data.xlsx';

% Read data
d = readtable(data_file_string);

% Run the model
two_way_jitter( ...
    'data_table', d, ...
    'test_variable', 'pCa50', ...
    'factor_1', 'factor_1', ...
    'factor_2', 'factor_2', ...
    'grouping', 'tag', ...
    'calling_path_string', cd, ...
    'y_from_zero',0)

% Save the figure to an image file
print('two_way_jitter.png','-dpng')
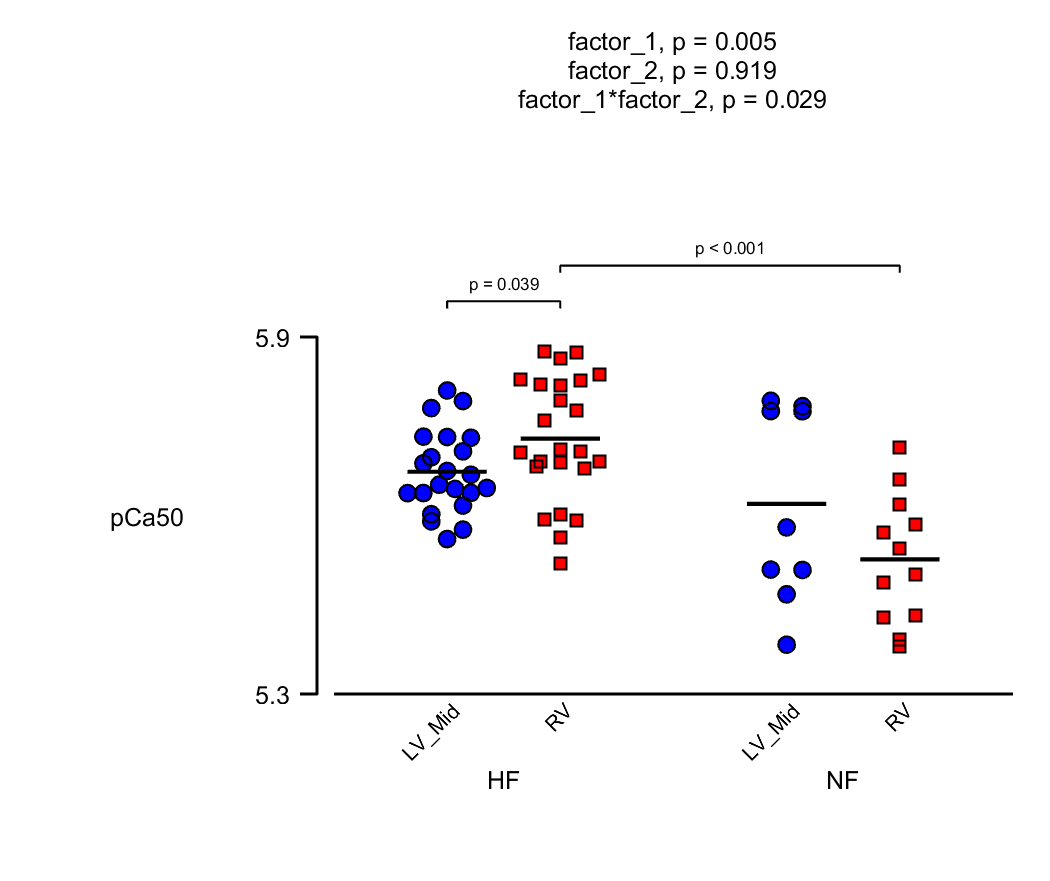
Output
Tips
- SAS cannot open Excel files that are already open
- close your Excel file before trying to run the MATLAB code
- including spaces in the group names crashes the attempt to scrape data from the SAS html output
- thus, “Organ_donor” instead of “Organ donor”
- the code logs status in sas_code.log
- use this file for trouble-shooting tips (e.g. SAS cannot open the Excel file, etc.)
- similarly, sas_results\sas_results.html, can also be useful for trouble-shooting
- the ‘y_from_zero’ option for two-way-jitter is because these particular data range from ~5 to ~6. Omit that line, or set to 1 for plots that start wtih y=0.