Example data
The image shows example data which you can download here
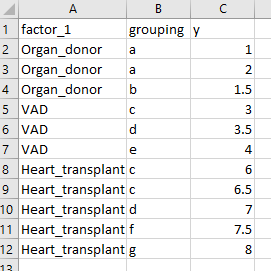
The 3 columns are as follows:
- factor_1: one of Organ_donor, VAD, Heart_transplant
- the One-way model will test whether there are differences between these groups
- grouping: a letter from a to g that indicates the “source” of the data.
- this factor is used to define “repeated measures”.
- Imagine a scenario in which each letter identifies a person. In this example, we have
- 2 measurements from person a who is an organ donor
- 3 measurements from person c, one when they were a VAD recipient, and 2 when they received a transplant
- 2 measurements from person d, one when they were a VAD recipient, and 1 when they received a transplant.
- y: the data we are testing
One-way model in SAS
Code
The SAS code to run a 1-way linear mixed model is as follows (adjust your paths as required).
/* SAS template for a 1 way analysis with a grouping variable */

proc import out = work.all_data
	datafile = "C:\ken\GitHub\CampbellMuscleLab\howtos\howtos_linear_mixed_models\docs\pages\MATLAB\one_way_model\data\one_way_data.xlsx"
	dbms = xlsx replace;
	sheet = "Sheet1";
	getnames=yes;
run;

ods html file="C:\ken\GitHub\CampbellMuscleLab\howtos\howtos_linear_mixed_models\docs\pages\MATLAB\one_way_model\sas_results\sas_results.html";
ods listing close;

proc print data=all_data;
	title1 'All data';
run;

proc glimmix data=all_data;
	class factor_1 grouping;
	model y = factor_1 /ddfm=satterthwaite;
	random grouping;
	lsmeans factor_1 /slice = factor_1 pdiff adjust=tukey;
run;

ods listing;
ods html close;
Results
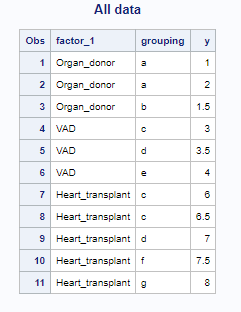
When run in the SAS environment, this produces an output file in html format
Interpretation
The top section of the results file shows the input data.
The next section that is critically important is the fixed effect section.
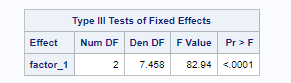
Here, the p value for factor_1 is <0.0001. This indicates that the 3 experimental groups are statistically different.
The last section shows the post-hoc tests.
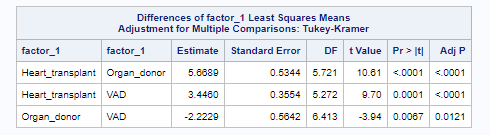
These show:
- Heart_transplant is different than Organ_donor, p < 0.0001
- Heart_transplant is different than VAD, p < 0.0001
- Organ_donor is different than VAD, p = 0.0121