Example data
The image shows the top part of the example data which you can download here
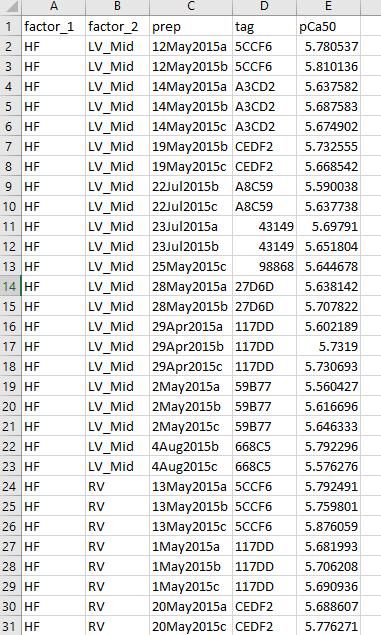
The 4 columns are as follows:
- factor_1: one of HF or NF
- factor_2: one of LV_Mid or RV
- prep: a string that is unique to each row
- tag: a string that defines the person the data that was obtained from
- For example, the top 2 rows have the same tag “5CCF6”.
- This means we have 2 values for HF, LV_Mid from person 5CCF6.this factor is used to define “repeated measures”.
- If you look further down the data file
- you can see that we also have 3 values from this person from the RV
- For example, the top 2 rows have the same tag “5CCF6”.
- pCa50: the data we are testing
Two-way model in SAS
Code
The SAS code to run a 2-way linear mixed model is as follows (adjust your paths as required).
/* SAS template for a 2 way analysis with a grouping variable */

proc import out = work.all_data
	datafile = "C:\ken\GitHub\CampbellMuscleLab\howtos\howtos_linear_mixed_models\docs\pages\MATLAB\two_way_model\data\two_way_data.xlsx"
	dbms = xlsx replace;
	sheet = "Sheet1";
	getnames=yes;
run;

ods html file="C:\ken\GitHub\CampbellMuscleLab\howtos\howtos_linear_mixed_models\docs\pages\MATLAB\two_way_model\sas_results\sas_results.html";
ods listing close;

proc print data=all_data;
	title1 'All data';
run;

proc glimmix data=all_data;
	class factor_1 factor_2 tag;
	model pCa50 = factor_1 factor_2 factor_1*factor_2 /ddfm=satterthwaite;
	random tag;
	lsmeans factor_1 factor_2 factor_1*factor_2 /slice = factor_1 slice = factor_2 slicediff=(factor_1 factor_2) pdiff adjust=tukey;
run;

ods listing;
ods html close;
Results
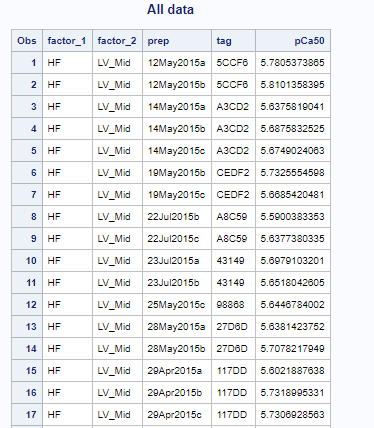
When run in the SAS environment, this produces an output file in html format
Interpretation
The top section of the results file shows the input data.
The next section that is critically important is section showing the main effects and their interaction.
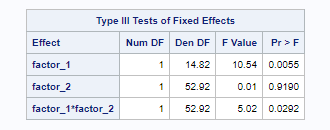
Here, the
- p value for factor_1 is 0.0055
- This indicates that the HF and NF groups are statistically different
- p value for factor_2 is 0.919
- This indicates that there is no statistical difference between LV_Mid and RV
- p value for factor_1 * factor_2 (interaction) is 0.029
- This indicates that the effect of factor_1 depends on the value of factor_2
The last section shows the post-hoc tests.
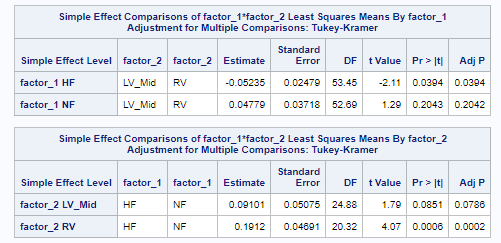
These show:
- in HF samples, LV_Mid and RV are statistically different (p=0.0394)
- in RV samples, HF and NF are statistically different (p=0.0002)