Assigning the isotype of specific molecules
Overview
The prior examples in this section define the proportion of myosin heads of each isotype through an instruction file key like
"m_isotype_proportions": [0.7, 0.3]
This approach assigns each head in a dimer to the same isotype. 70% of the dimers wil be of isotype 1. 30% of the heads will be of isotype 2. The allocation is random.
This demo shows how to assign specific myosin heads and specific MyBP-C molecules to defined isotypes.
What this demo does
This demo:
- Simulates a half-sarcomere undergoing an isometric contraction
- There are two isotypes of myosin. The kinetics for the second isotype are slower than that of the first isotype
- The first head in every myosin dimer is isotype 1. The second head in every dimer is isotype 2.
- There are also two isotypes of MyBP-C. The first isotype attaches to actin. The second isotype can transition to a state where it stabilizes myosin heads.
- There are 27 MyBP-C molecules arranged in 9 stripes of 3 molecules. All of the molecules within a stripe have the same isotype but the isotype alternates between stripes.
- You can make the simulations smoother by increasing the
m_nparameter in the setup file. - Status files are written for every 10th time-step. You can increase the time-resolution of the isotype plots by changing the
time_stepsparameter in the options file. For example, changing the string to1:3:500would save the status at every 3 time-step.
Instructions
If you need help with these step, check the installation instructions.
- Open an Anaconda prompt
- Activate the FiberSim environment
- Change directory to
<FiberSim_repo>/code/FiberPy/FiberPy - Run the command
python FiberPy.py characterize "../../../demo_files/isotpyes/specific_molecules/base/setup.json"
- You should see text appearing in the terminal window, showing that the simulations are running. When it finishes (this may take a few minutes), you should see something similar to the image below.
Viewing the results
All of the results from the simulation are written to files in <FiberSim_repo>/demo_files/isotypes/twitch/sim_data/sim_output
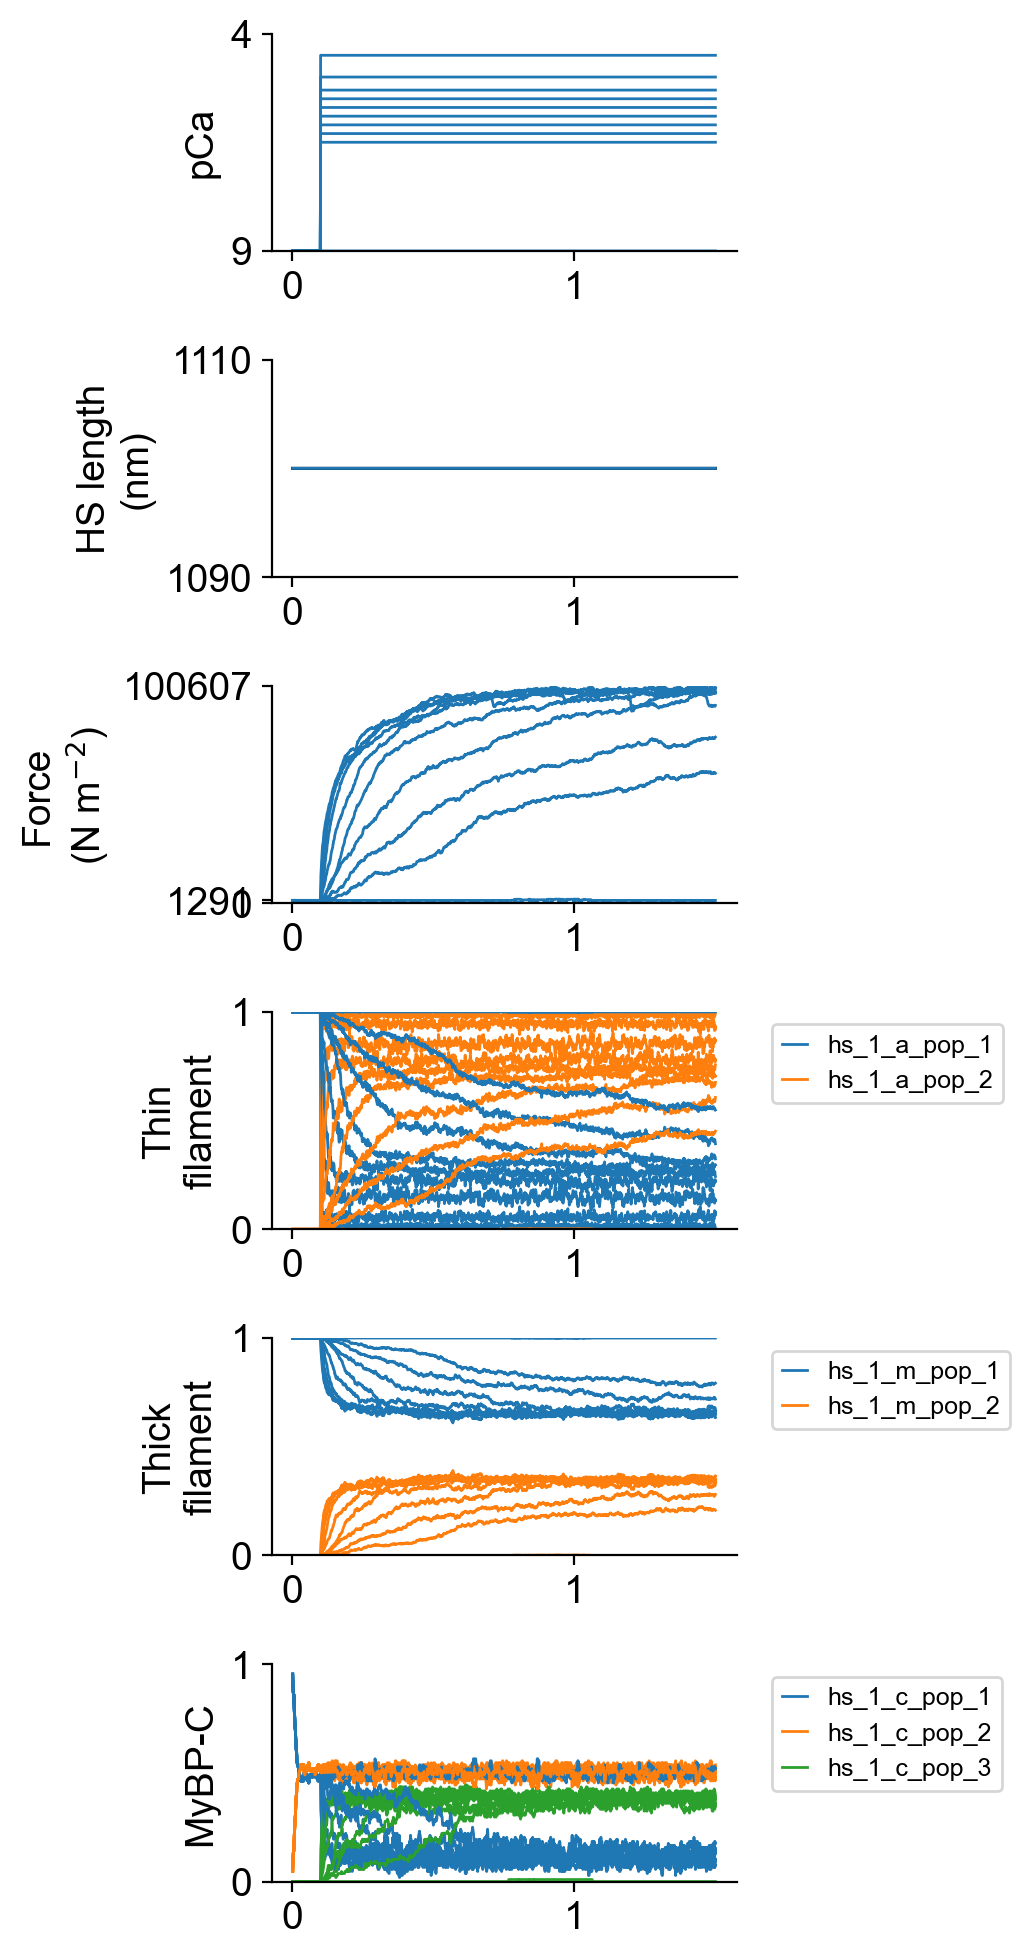
The file superposed_traces.png shows pCa, length, force per cross-sectional area (stress), and thick and thin filament properties plotted against time. In this figure, the thick filament state populations are the total number of heads in each state. This figure does not break these profiles out by isotype.
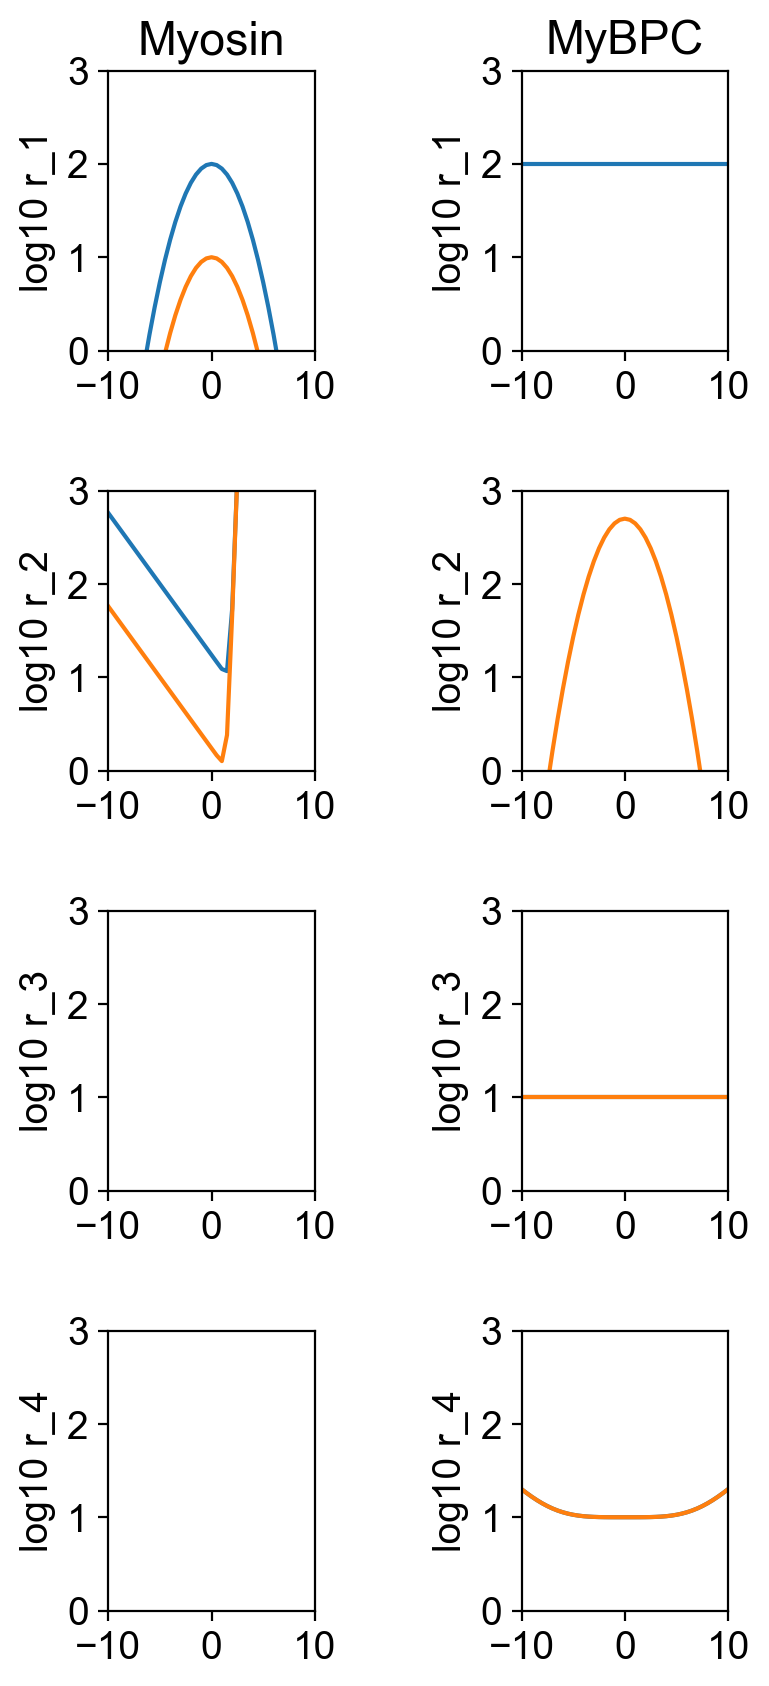
You can also the rates for the two isotypes.
Most importantly for this demo, you will also see a new figure that shows the state population time-courses for each myosin isotype. This was generated using the same post-simulation Python call as described in k_tr_demo.
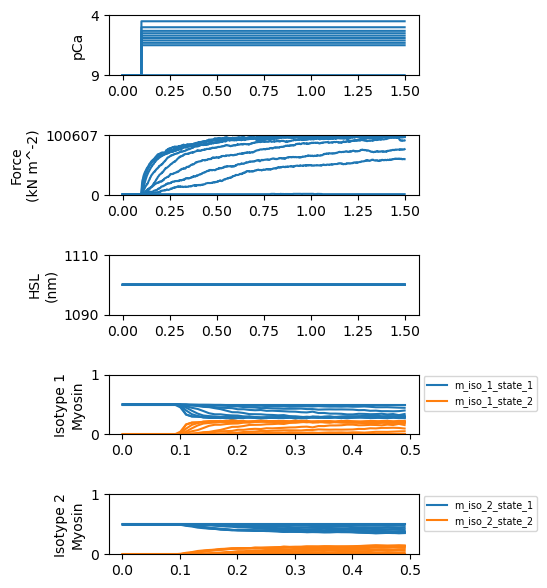
This code could be extended to show the MyBP-C isotypes in addition.
How this worked
The model file (found in <repo>/demo_files/isotypes/specific_molecules/base/model.json) defined two isotypes for myosin as described here.
Similarly, the model described two isotypes of MyBP-C.
The key difference in this demo is that the isotype_proportion keys for myosin and MyBP-C have been replaced by longer arrays. Specifically:
"m_parameters": {
    "m_k_cb": 0.001,
    "m_isotype_ints": [1, 2, 1, 2, 1, 2, 1, 2, 1, 2, 1, 2, 1, 2, 1, 2, 1, 2, 1, 2, 1, 2, 1, 2, 1, 2, 1, 2, 1, 2, 1, 2, 1, 2, 1, 2, 1, 2, 1, 2, 1, 2, 1, 2, 1, 2, 1, 2, 1, 2, 1, 2, 1, 2, 1, 2, 1, 2, 1, 2, 1, 2, 1, 2, 1, 2, 1, 2, 1, 2, 1, 2, 1, 2, 1, 2, 1, 2, 1, 2, 1, 2, 1, 2, 1, 2, 1, 2, 1, 2, 1, 2, 1, 2, 1, 2, 1, 2, 1, 2, 1, 2, 1, 2, 1, 2, 1, 2, 1, 2, 1, 2, 1, 2, 1, 2, 1, 2, 1, 2, 1, 2, 1, 2, 1, 2, 1, 2, 1, 2, 1, 2, 1, 2, 1, 2, 1, 2, 1, 2, 1, 2, 1, 2, 1, 2, 1, 2, 1, 2, 1, 2, 1, 2, 1, 2, 1, 2, 1, 2, 1, 2, 1, 2, 1, 2, 1, 2, 1, 2, 1, 2, 1, 2, 1, 2, 1, 2, 1, 2, 1, 2, 1, 2, 1, 2, 1, 2, 1, 2, 1, 2, 1, 2, 1, 2, 1, 2, 1, 2, 1, 2, 1, 2, 1, 2, 1, 2, 1, 2, 1, 2, 1, 2, 1, 2, 1, 2, 1, 2, 1, 2, 1, 2, 1, 2, 1, 2, 1, 2, 1, 2, 1, 2, 1, 2, 1, 2, 1, 2, 1, 2, 1, 2, 1, 2, 1, 2, 1, 2, 1, 2, 1, 2, 1, 2, 1, 2, 1, 2, 1, 2, 1, 2, 1, 2, 1, 2, 1, 2, 1, 2, 1, 2, 1, 2, 1, 2, 1, 2, 1, 2, 1, 2, 1, 2, 1, 2, 1, 2, 1, 2, 1, 2, 1, 2, 1, 2, 1, 2, 1, 2, 1, 2, 1, 2, 1, 2, 1, 2, 1, 2, 1, 2, 1, 2, 1, 2, 1, 2, 1, 2, 1, 2]
  }
and
"c_isotype_ints": [1, 1, 1, 2, 2, 2, 1, 1, 1, 2, 2, 2, 1, 1, 1, 2, 2, 2, 1, 1, 1, 2, 2, 2, 1, 1, 1]
Each element in these arrays defines the isotypes for the corresponding molecule.
Since m_isotype_ints alternates between 1 and 2, and heads are arranged in dimer pairs, each dimer contains one molecule of each isotype.
In contrat, c_isotype_ints contain triplets. Since there are three MyBP-C molecules for every 3rd myosin crown, the MyBP-C molecules are arranged in isotype ‘stripes’.