Single curve
Overview
This demo shows how to simulate pCa curves at different lengths.
What this demo does
This demo:
- Builds on the single pCa curve trial and runs simulations in which a half-sarcomere is held at different lengths and subjected to a ktr maneuver at a range of pCa values
- Analyses the data
- Plots summaries of the simulation
Instructions
If you need help with these step, check the installation instructions.
- Open an Anaconda prompt
- Activate the FiberSim environment
- Change directory to
<FiberSim_repo>/code/FiberPy/FiberPy - Run the command
python FiberPy.py characterize "../../../demo_files/pCa_curves/different_lengths/base/setup.json"
Viewing the results
All of the results from the simulation are written to files in <FiberSim_repo>/demo_files/pCa_curves/different_lengths/sim_data/sim_output
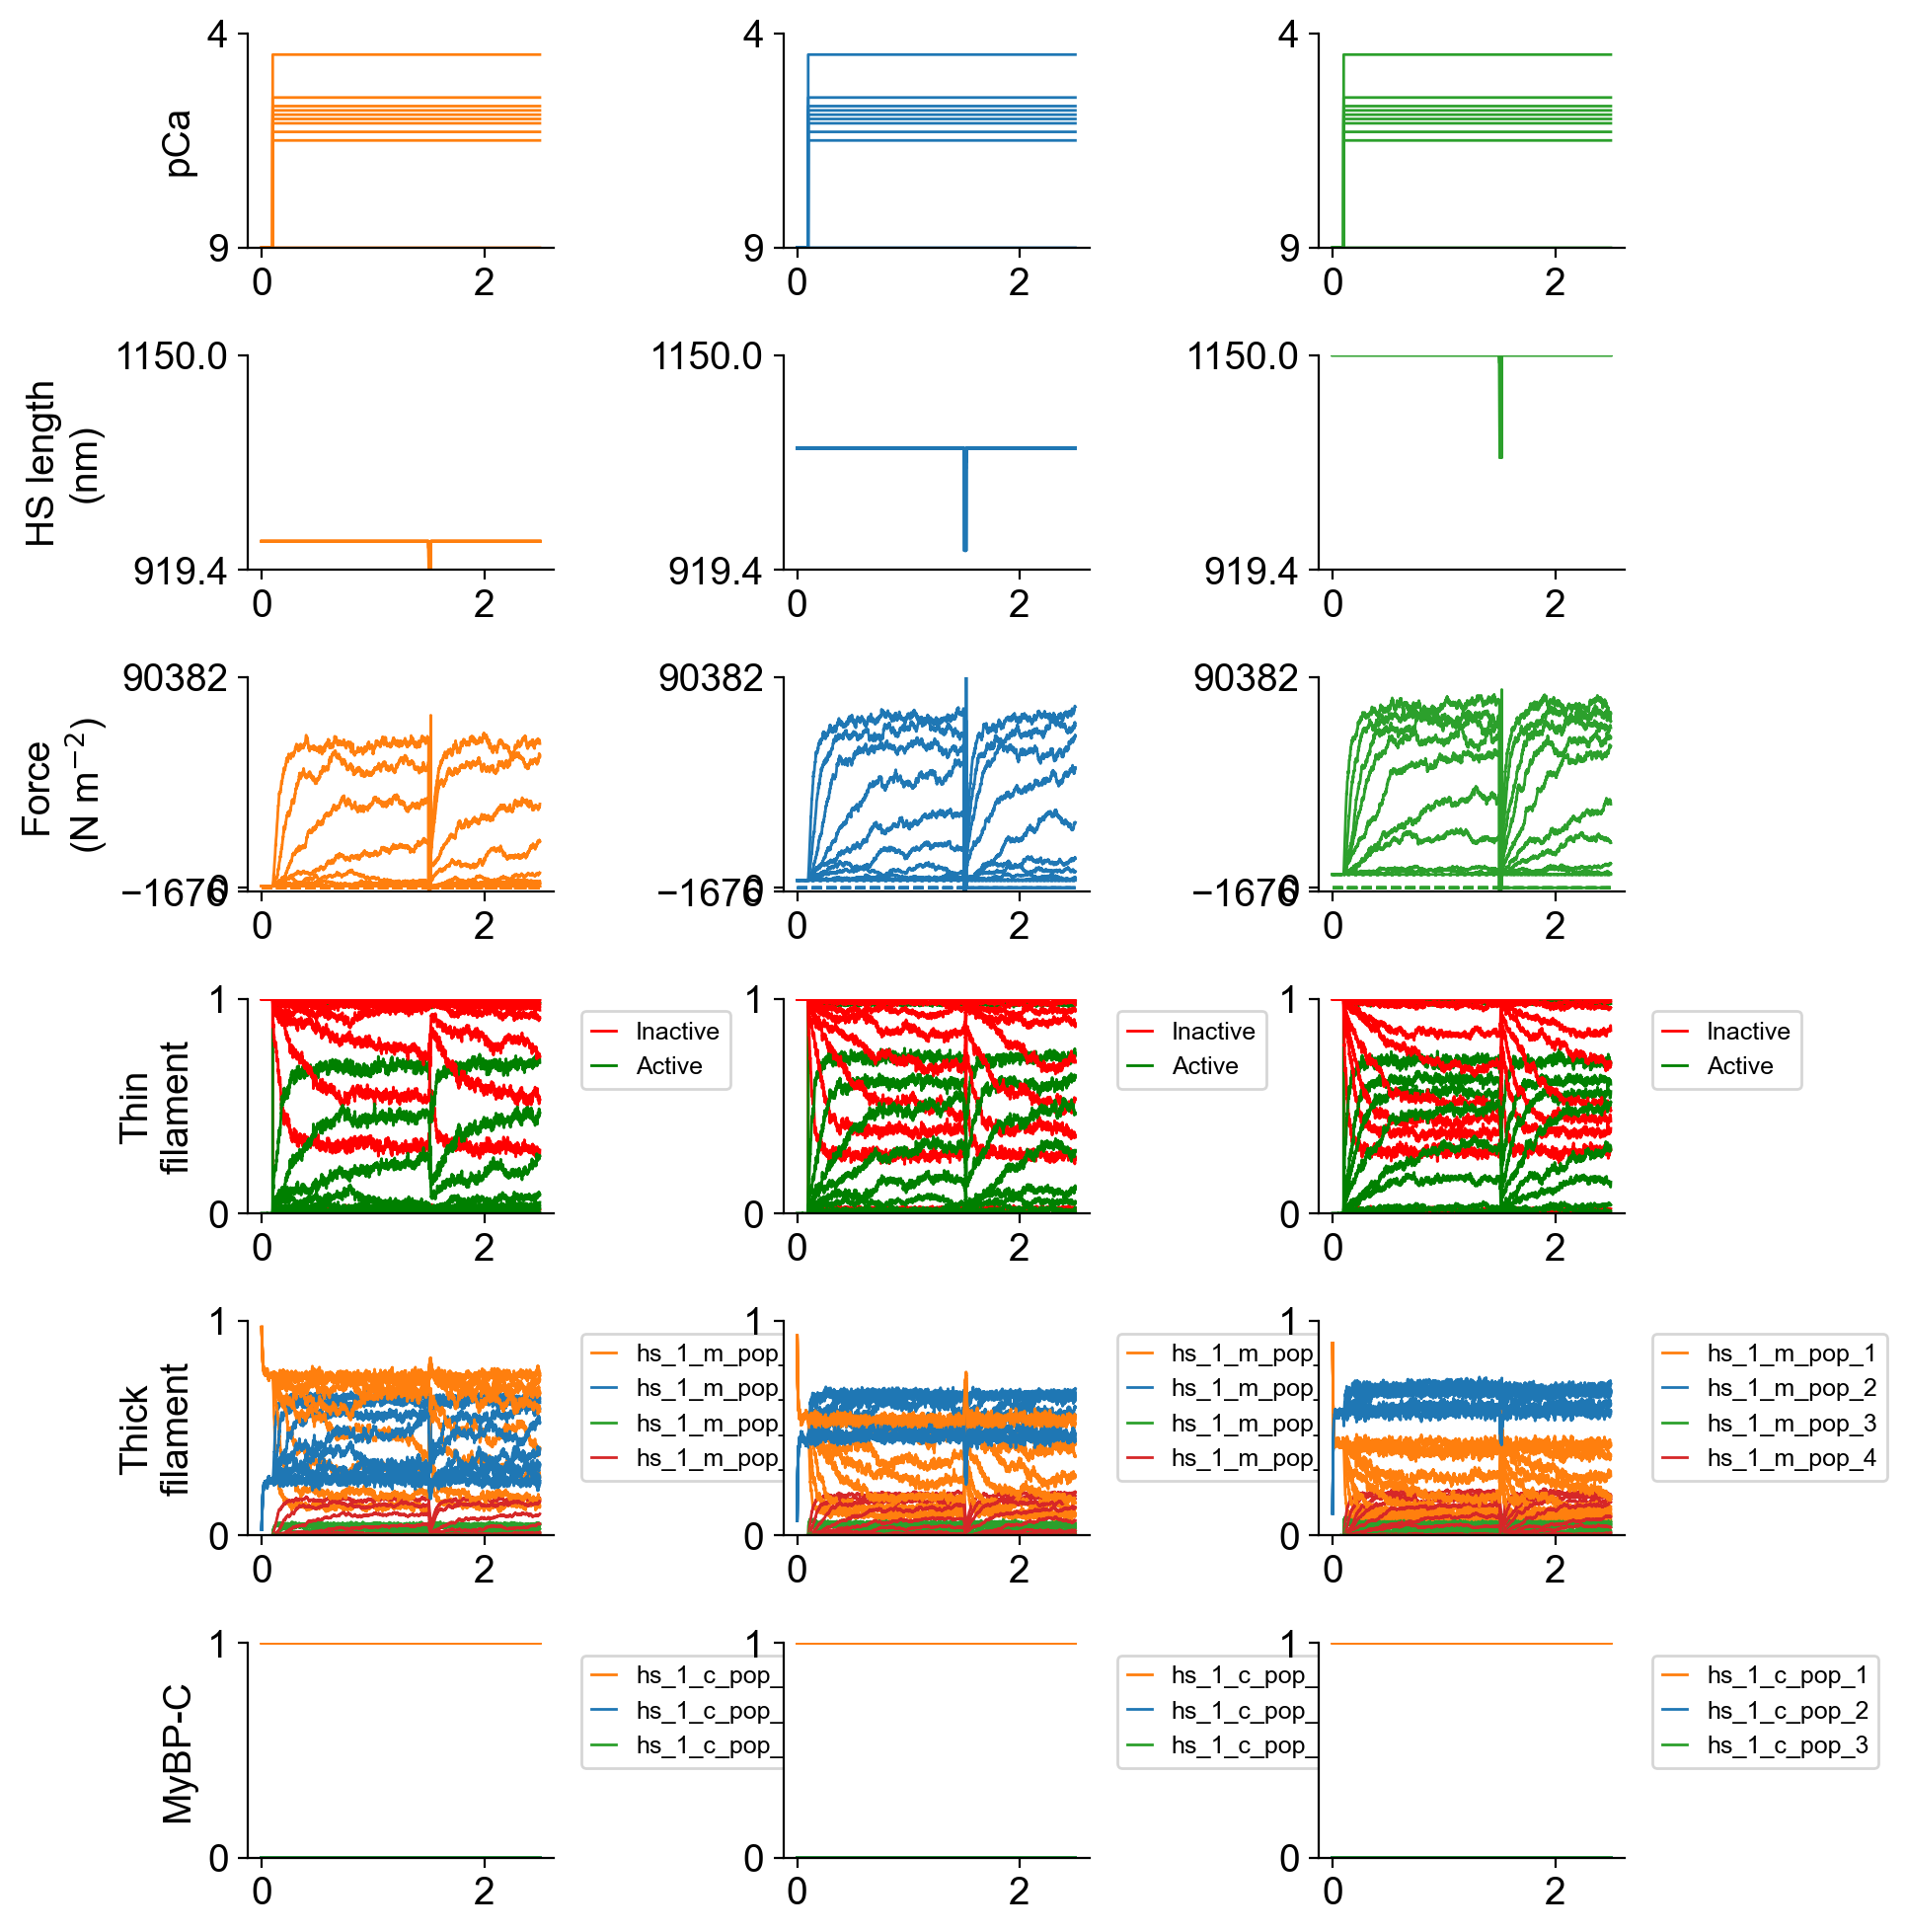
The file superposed_traces.png shows pCa, length, force per cross-sectional area (stress), and thick and thin filamnt properties plotted against time. The simulations at different lengths are plotted in different columns.
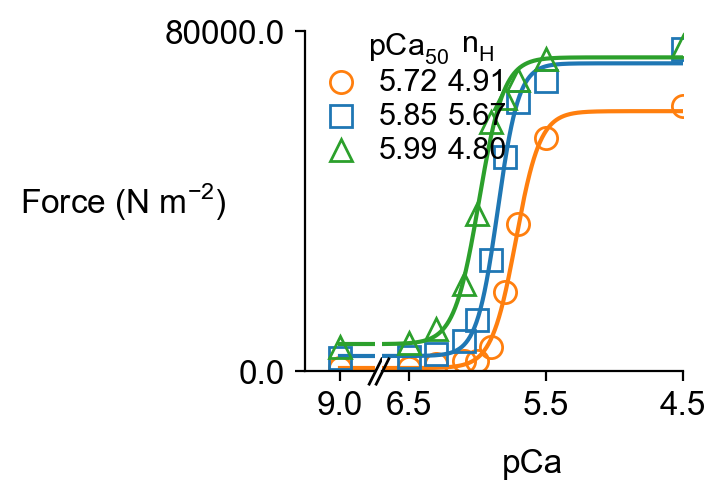
Since the simulations included more than 1 pCa value, FiberPy created pCa curves force_pCa.png
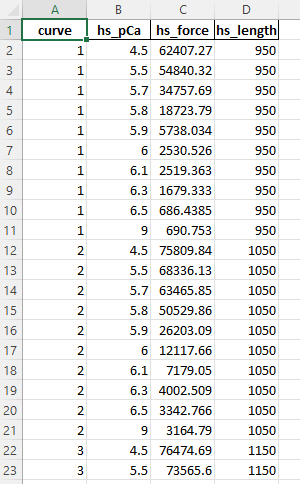
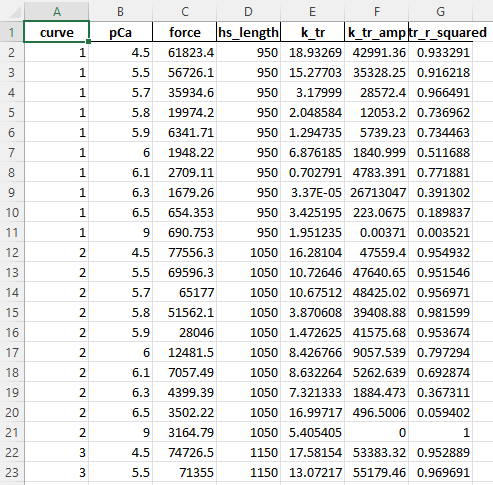
and wrote summary data to pCa_analysis.xlsx
Since the code simulated a ktr maneuver, FiberPy also created a figure showing the analyis of the tension recovery.
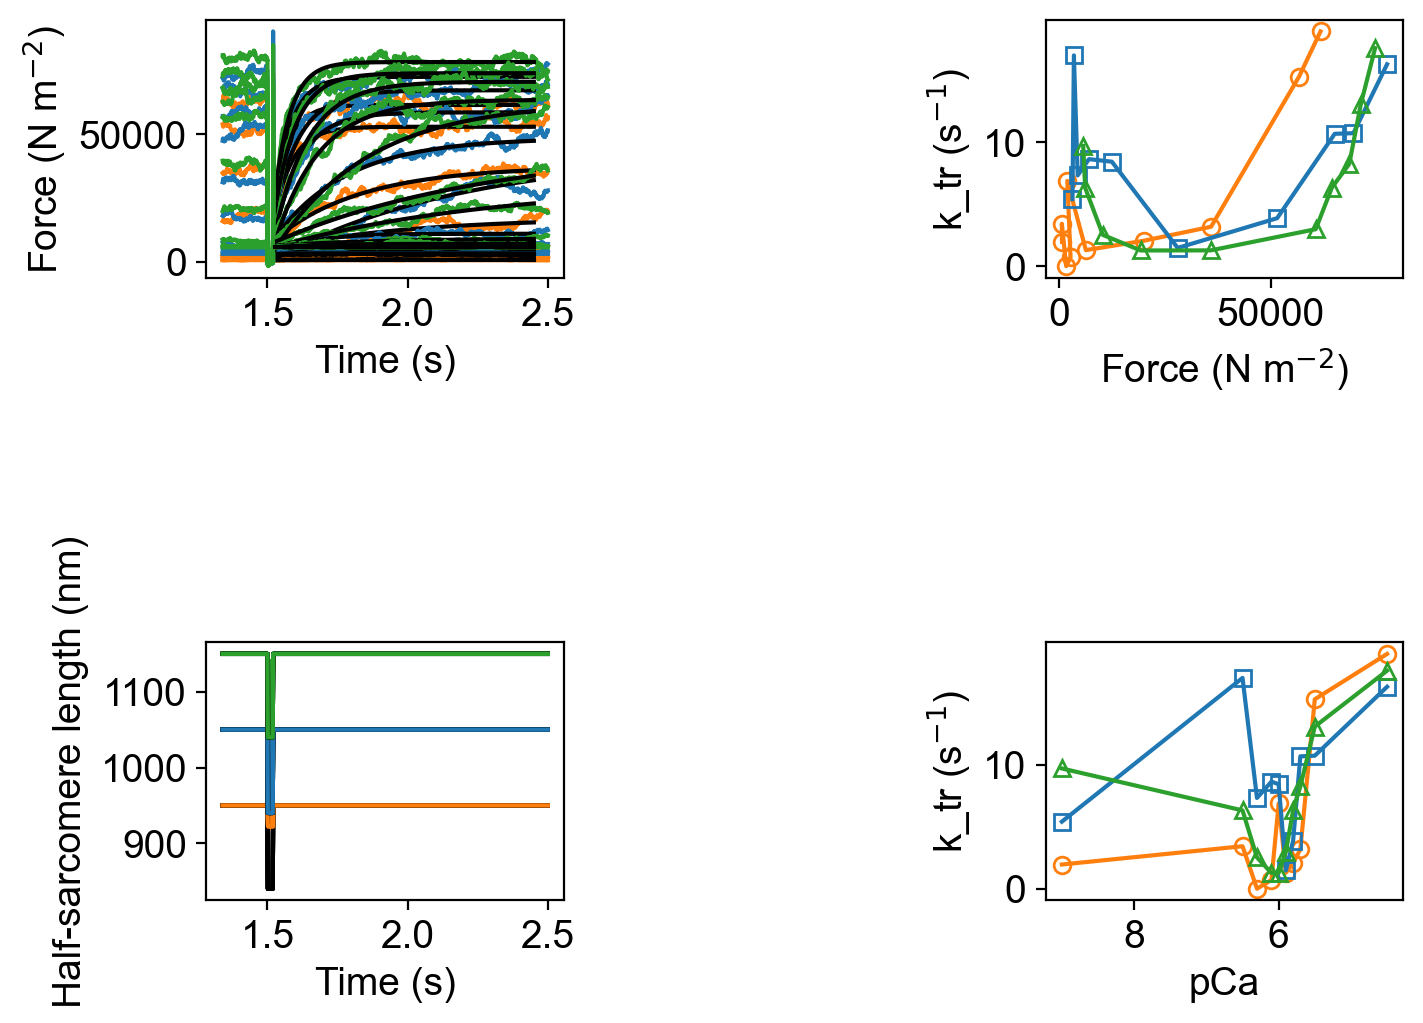
and wrote summary data to k_tr_analysis.xlsx.
How this worked
The only difference between this simulation and the single curve trial is that the three half-sarcomere lengths were specified in the characterization structure. If no length is specified, the simulations are based on the single length specified in the model file.
"characterization": [
        {
            "type": "pCa_length_control",
            "relative_to": "this_file",
            "sim_folder": "../sim_data",
            "hs_lengths": [950, 1050, 1150],
            "m_n": 9,
            "pCa_values": [9, 6.5, 6.3, 6.1, 6.0, 5.9, 5.8, 5.7, 5.5, 4.5],
            "sim_duration_s": 2.5,
            "time_step_s": 0.001,
            "pCa_step_up_s": 0.1,
            "k_tr_start_s": 1.5,
            "k_tr_duration_s": 0.02,
            "k_tr_ramp_s": 0.001,
            "k_tr_magnitude_nm": 100,
            "k_tr_fit_time_s": [1.525, 2.45],
            "output_image_formats": [ "png" ],
            "figures_only": "False",
            "trace_figures_on": "False"
        }
    ]